The Tax Burden Footprint of Tax-Exempt Properties
Felix Landry, AICP, is a planner with Verdunity, a Dallas-based planning and engineering firm whose work is deeply influenced by the Strong Towns message. This article is republished with permission from Verdunity’s Go Cultivate! blog.
Click to view larger.
Footprints have been around for a while. Dinosaurs left them in the mud and astronauts left them on the moon. Recently, though, I more often hear about environmental, carbon, and ecological footprints, and for good reason. Personally, and as a company, we prioritize good stewardship. That naturally includes our ecological resources. It also includes our economic resources.
We have some (marginal) societal awareness about the ecological burden of our consumption habits, but do we know anything about the fiscal burden of our built environment? Do we understand the fiscal footprint we create through the way we design and build public facilities such as city halls, schools, libraries, parks, streets, and roads?
Many of us have seen some graphic that shows how many earths we’d need if everyone lived like an American. The Global Footprint Network has some fun datasets and maps that they publish illustrating ecological footprints. The map below struck me when I saw it because its color scheme reminds me of some of the maps we’ve made for cities we’ve worked with.
We do something similar with a city’s fiscal footprint. We look at revenue and cost and how different development patterns impact the overall city. These types of maps inform a variety of talking points, one of which I’d like to focus on here. That is: how do we reduce the red?
We created the map below as part of a fiscal analysis project we completed for the City of Bastrop (TX) earlier this year. The colors illustrate the return on investment (ROI) for their current budget using their existing development patterns. This doesn’t include any unfunded infrastructure or service needs, so it’s a little misleading without the rest of the study, but I want to focus on the white space between the colored areas.
A return-on-investment (ROI) map of Bastrop, Texas. Note the amount of white space within city limits; that indicates properties that are tax-exempt and do not generate revenue for the City.
Large chunks of that white space consist of tax-exempt properties. Those properties produce zero revenue for the City of Bastrop, while still creating a cost burden (since they require public money to build and maintain). City Halls, schools, parks, and libraries will incur expenses (for the city) just as much as tax-generating residential and commercial properties do. And in a sense, these tax-exempt properties can be said to have an additional fiscal burden by occupying potential revenue-producing land.
It makes sense for public institutions to keep this reality in mind when establishing their land use regulations. Those of us in the business of promoting fiscal sustainability tend to lament the extremely low ROI of typical suburban residential and commercial development—which combines low-density lots with oversized and very expensive infrastructure—but at least they’re generating some revenue. We should have even greater concern for low-density public institutional development.
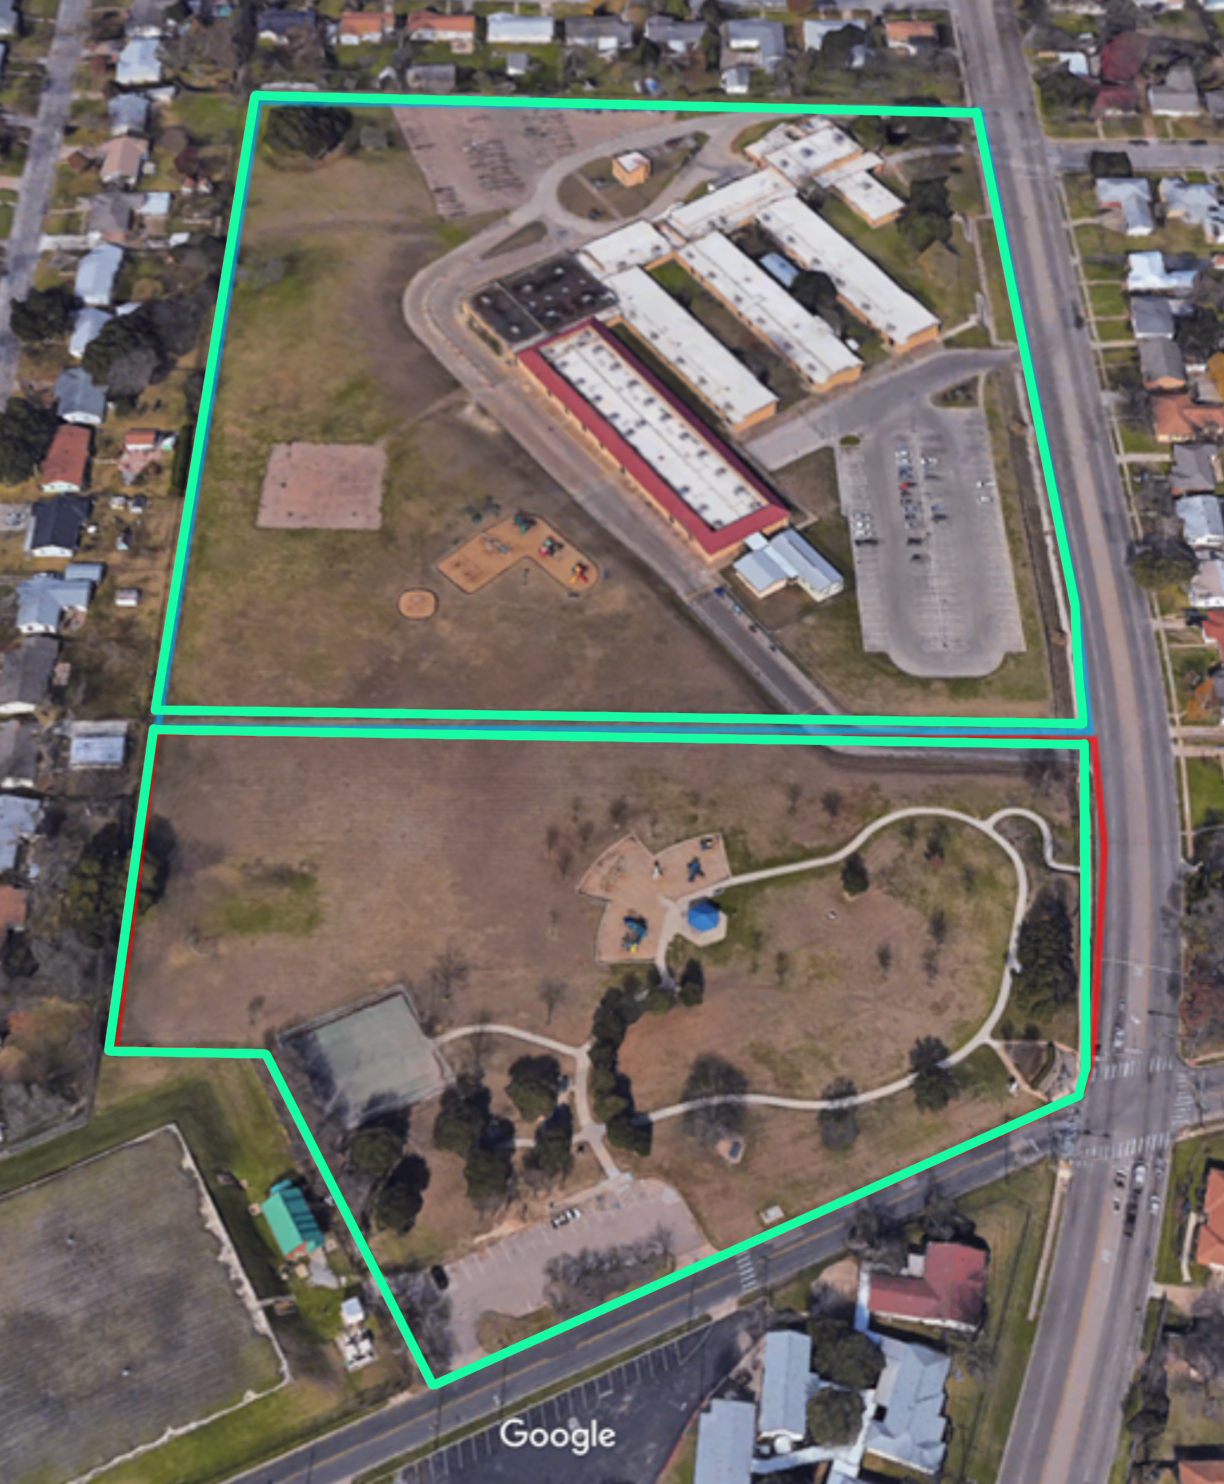
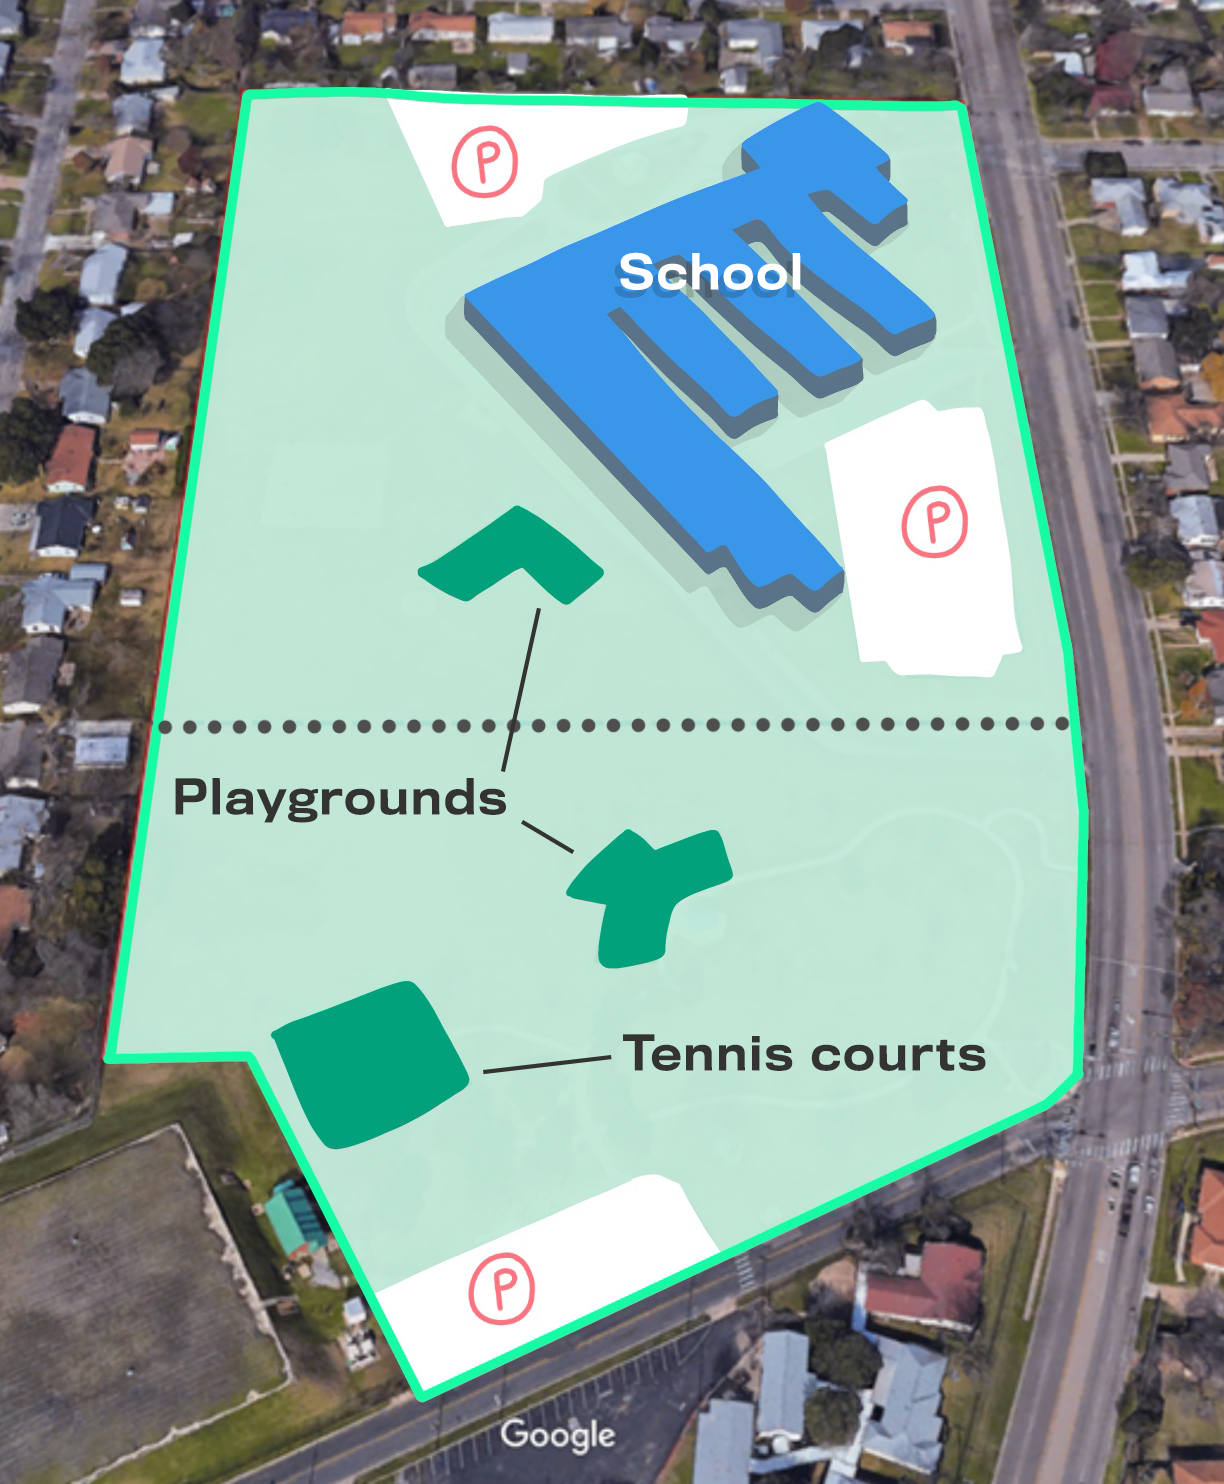
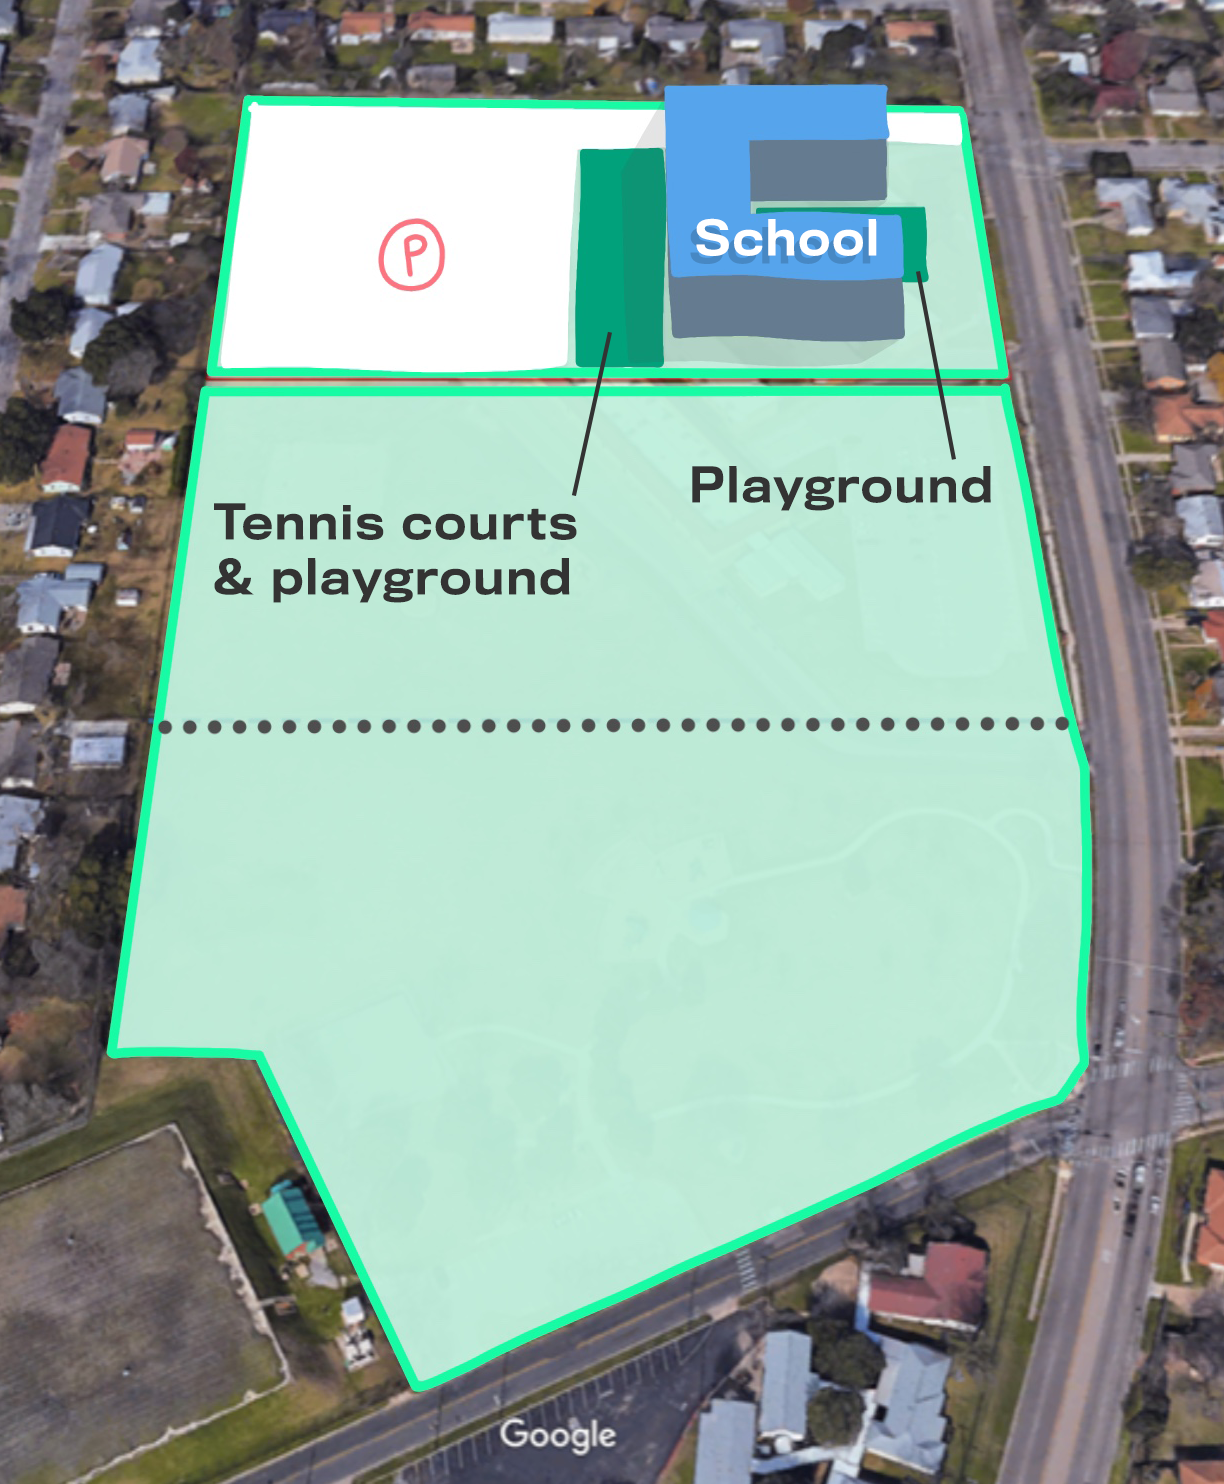
This slide show of images is a great example of public institutional development at a very low density and high (infrastructure) cost footprint. I’ve outlined the school and park properties green. The two properties are actually separated by a chain-link fence. In the second image, I have illustrated the space taken up by the two playgrounds, the tennis courts, and the school building. These two facilities together have a particularly large land footprint. They produce zero revenue, occupy lots of expensive road frontage, and eat up far more potentially revenue-producing land then they need to.
This same school built at two or three stories dramatically reduces its footprint (as in the third – hypothetical – image). The money spent on two decent playgrounds could have been spent on one exceptional playground, also reducing its footprint. Potentially, one could fit both the park and the school on a footprint one-third the size it currently occupies, opening up the other two thirds of the property to some form of development that generates revenue.
The overall up-front cost of building the same facilities on a smaller footprint would almost certainly be higher, but the benefits are numerous. First, the City and school district both benefit from the remaining property developing and generating additional tax revenues over the life of these facilities. They’d also have lower annual maintenance costs. The upkeep of the building and playground may not decrease but the amount of public right-of-way serving a tax-exempt property would dramatically decrease. It would occupy a smaller service area footprint for commercial businesses, creating more room for a higher concentration of potential customers for nearby businesses. In short, the overall cost burden of the site doesn’t change much, but the revenue potential increases dramatically—especially if the city decides to zone the space for higher-return-on-investment development types. (A side benefit: you avoid the scenario of people using the playground at the park and shaking their heads as they look through a chain link fence at a second publicly funded playground three hundred feet away.)
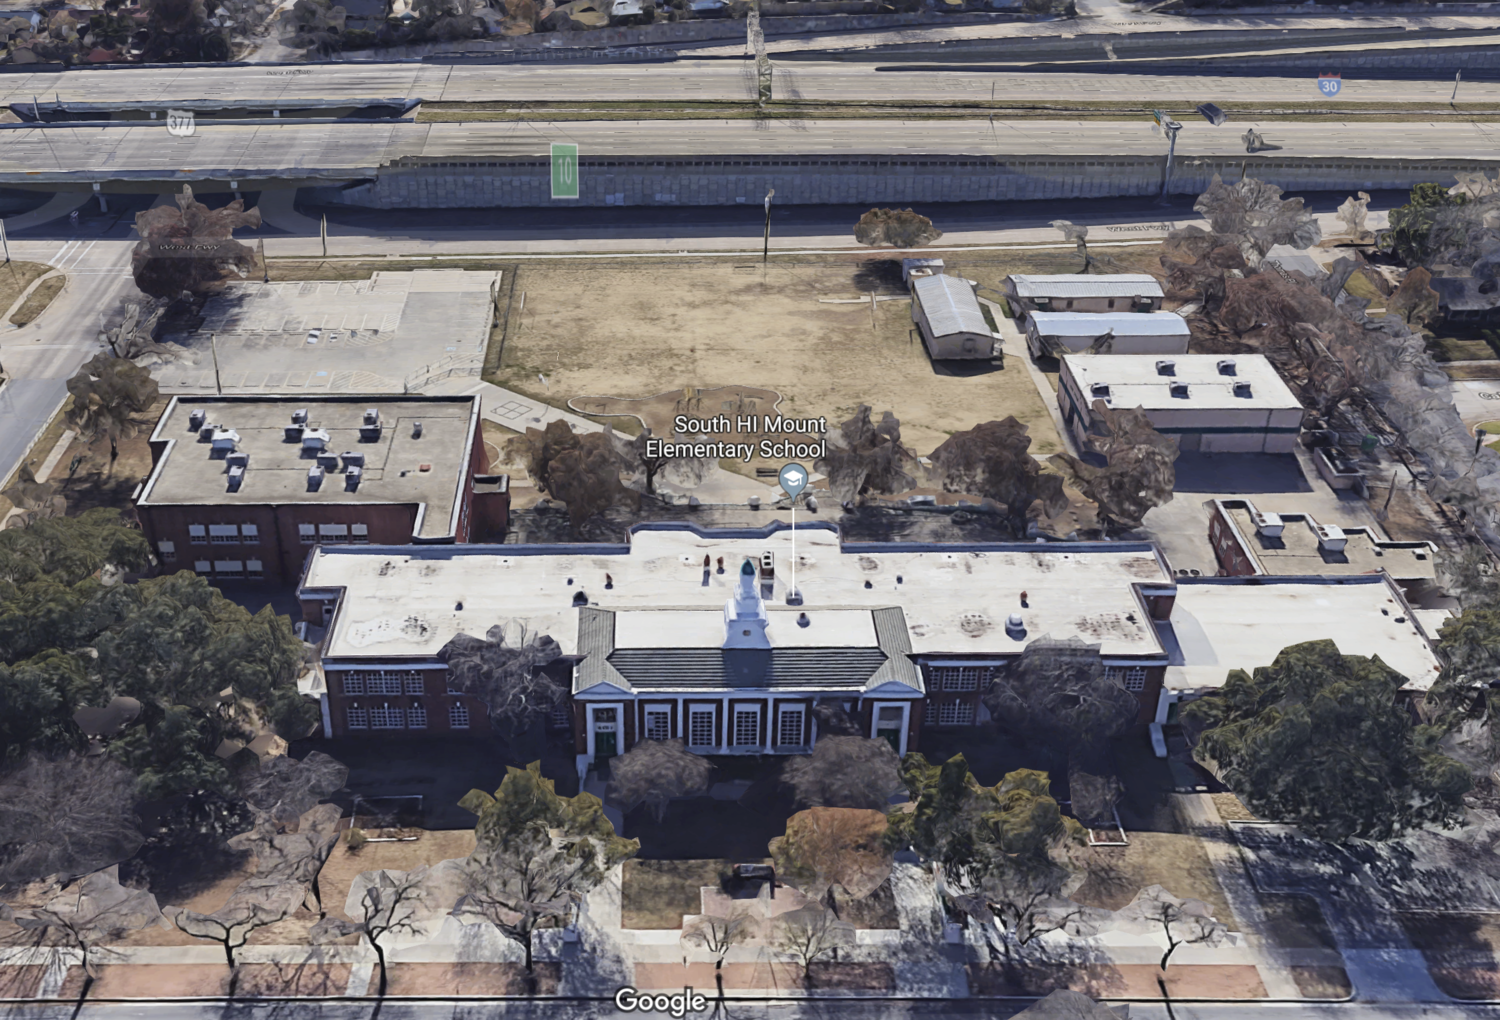
This building pattern is a relatively recent trend. Unfortunately, with all of our technological advancement we’ve managed to lower our built environment standards – and degrade our cities’ fiscal health as a result. For contrast, take a look at these examples from Fort Worth below. The first three images are the three public schools (elementary, middle, and high school – in order) that serve the Arlington Heights area, which developed in the first half of the 20th century.
✅ Older schools with smaller footprints:
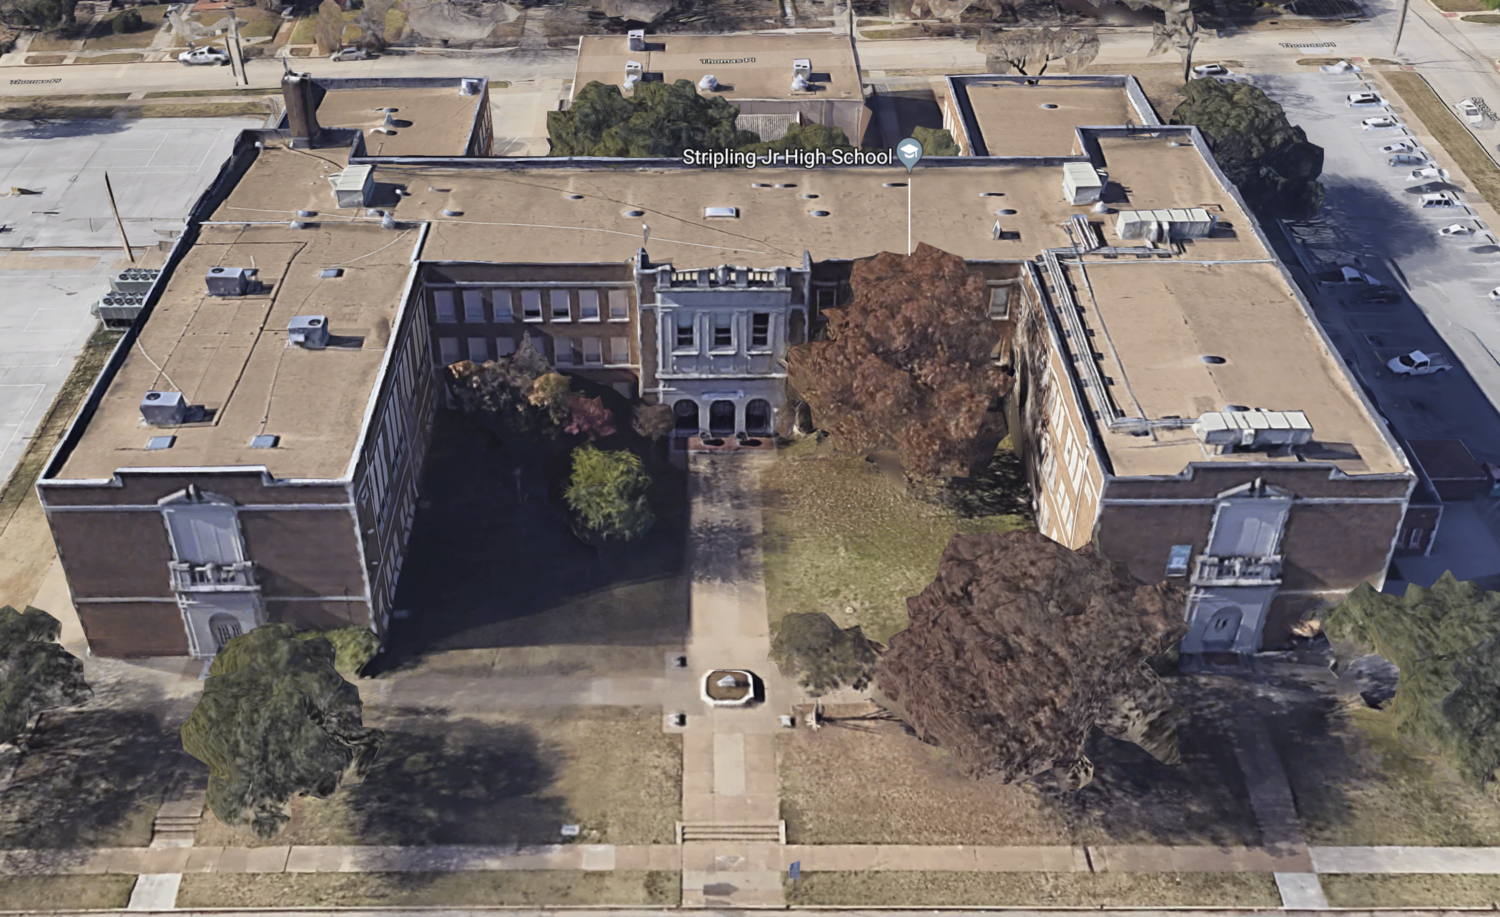
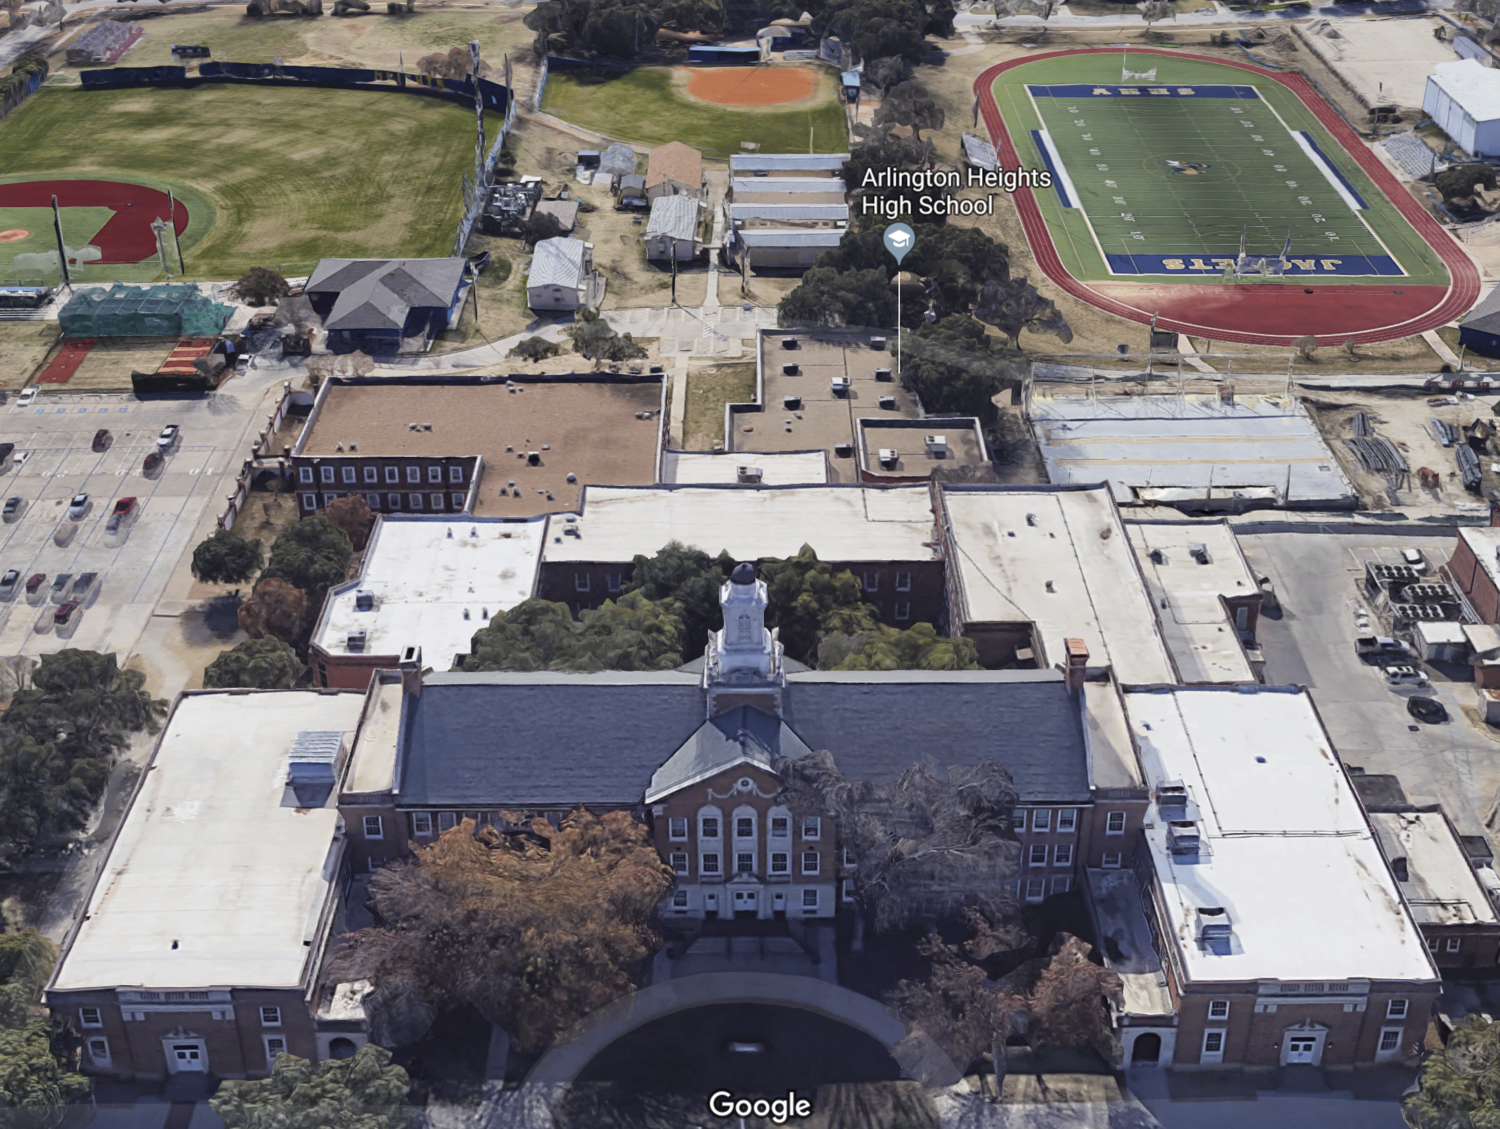
The next three are the three public schools (elementary, middle, and high school) serving a portion of Southwest Fort Worth, built in the second half of the 20th century.
❌ Newer schools with larger footprints:
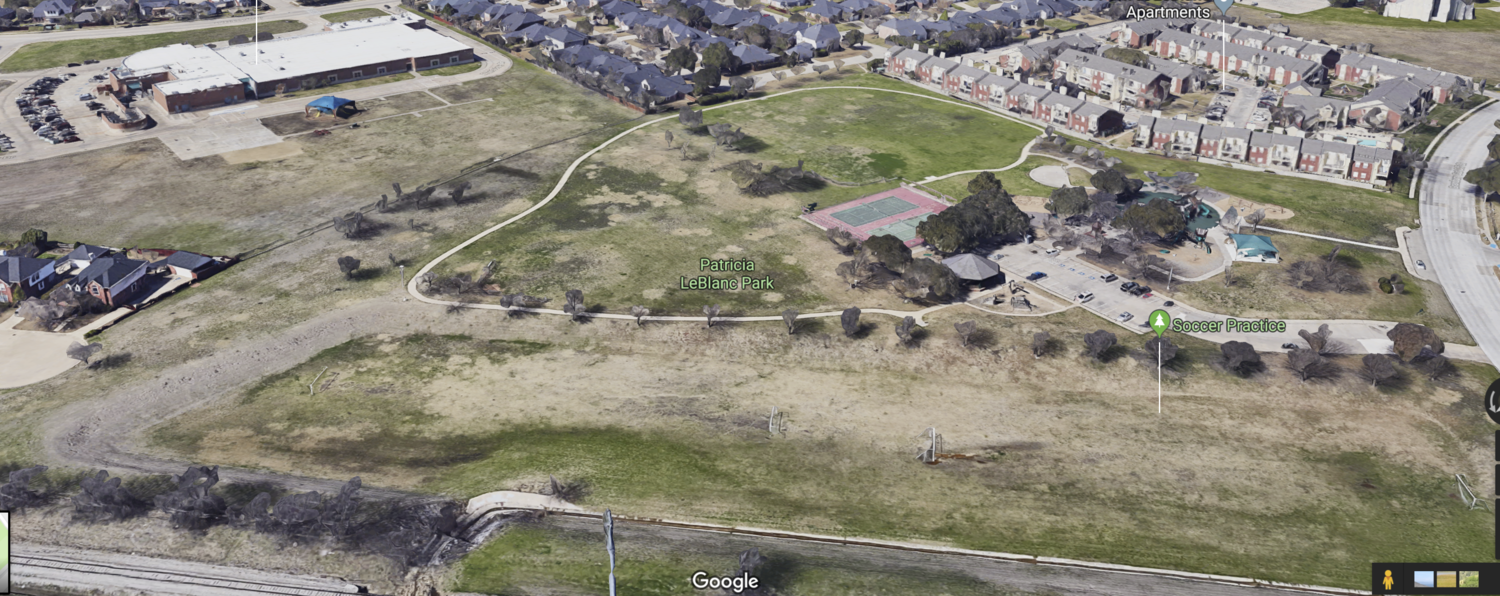
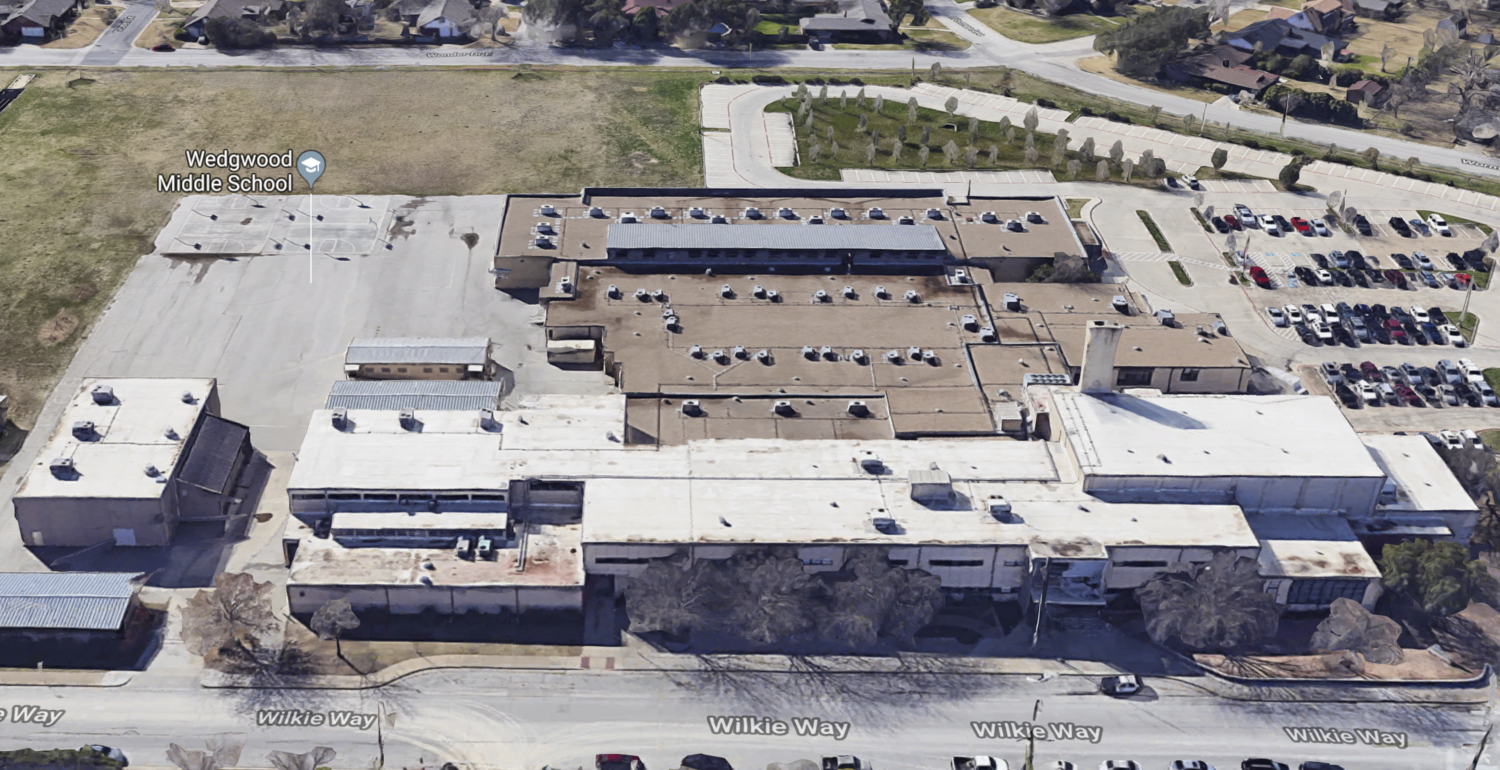
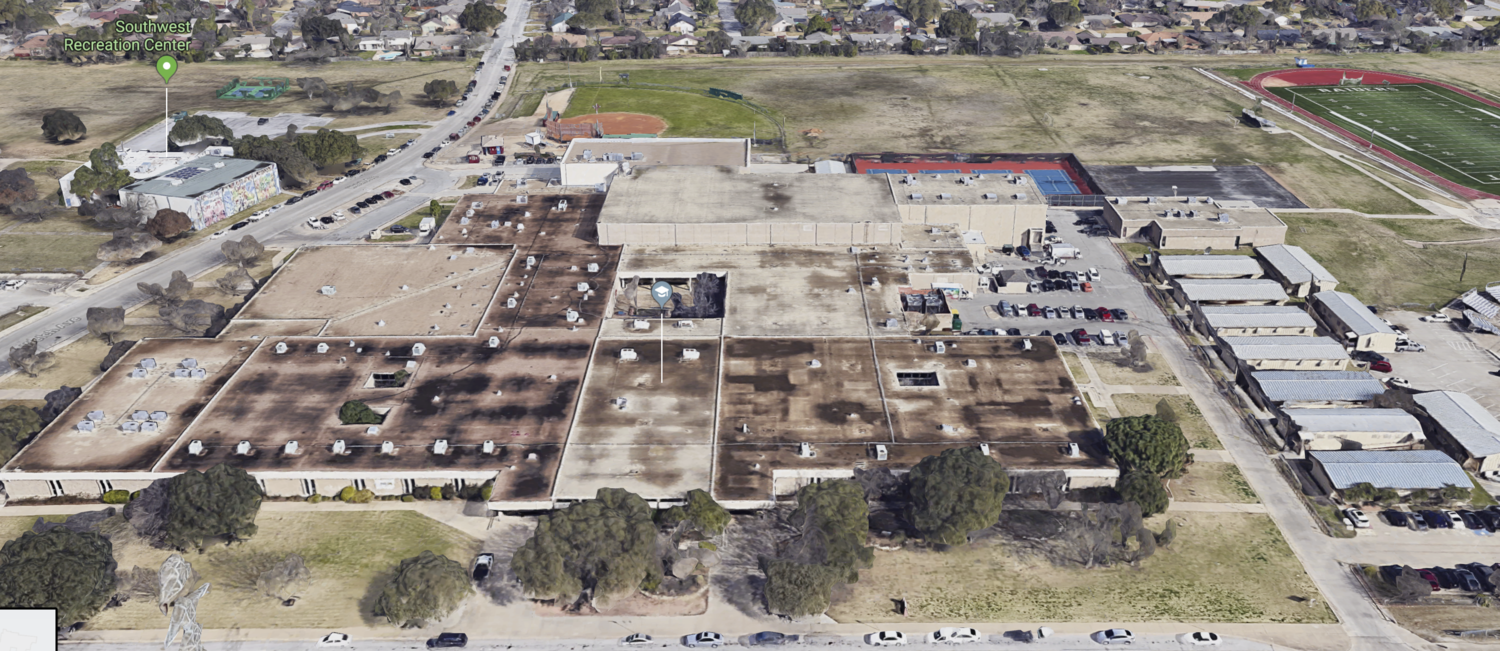
The older schools are all two or three stories and have a much smaller footprint than the newer schools. Of the second set of schools, only the middle school has any two story construction, and that comprises less than half of the structural footprint. The older schools also have more windows; they even open and close. The first image in the newer group of schools gives us an especially bad example of a low-density school property directly adjacent to a very large park. It’s also my opinion that the first set of schools are far more beautiful and create more engaging exterior spaces for the students and teachers.
This building pattern is a relatively recent trend. Unfortunately, with all of our technological advancement we’ve managed to lower our built environment standards – and degrade our cities’ fiscal health as a result.
Another big culprit of this trend comes, tragically, from our faith communities. In the planning profession, we’ve come to bemoan the big box stores with their low build quality, low tax revenue per acre, and high cost burden. So, what about the big box faith-based buildings? At least the big box stores generate some amount of revenue. Some may protest, “Leave the religions alone; they provide a public good that can’t be measured with money.” Our society already agrees that the goods and services they provide have value beyond fiscal analysis; that’s why they’re tax exempt. However, the physical footprint a faith-based structure occupies, and its cost burden, do not lie beyond critique.
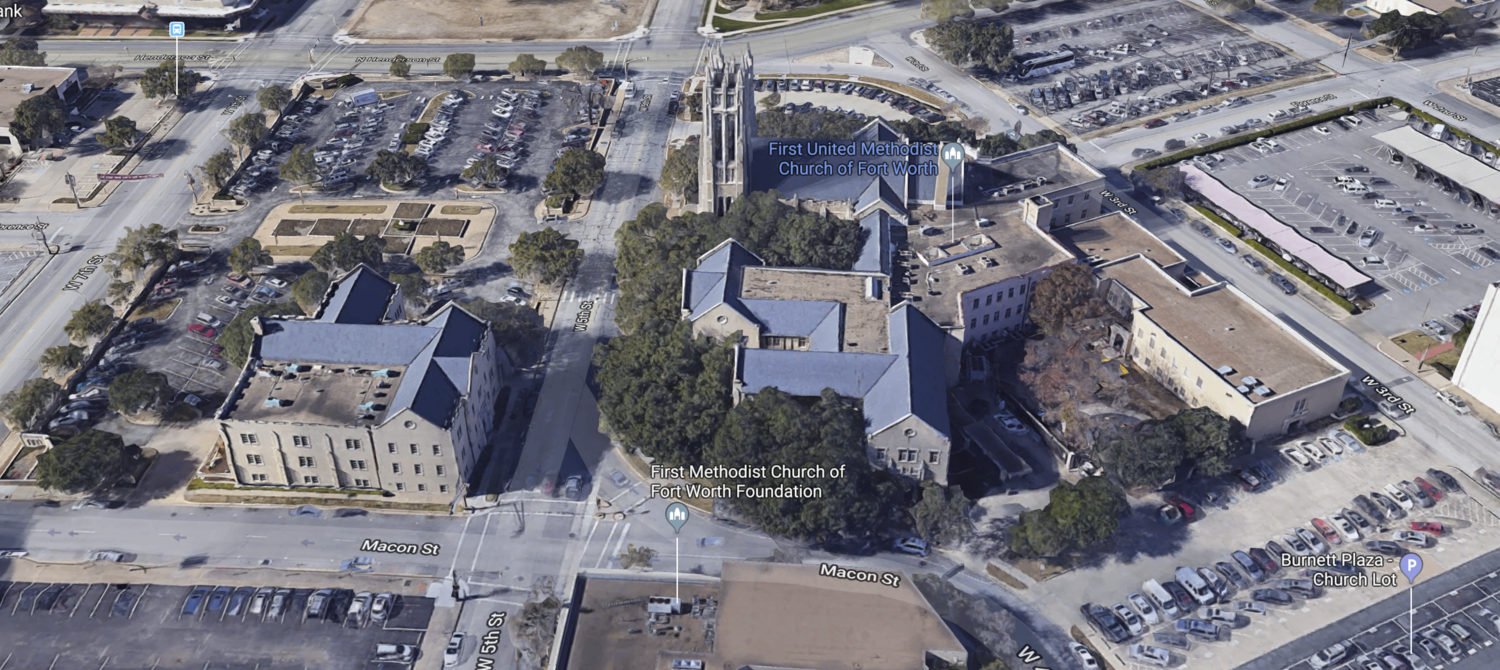
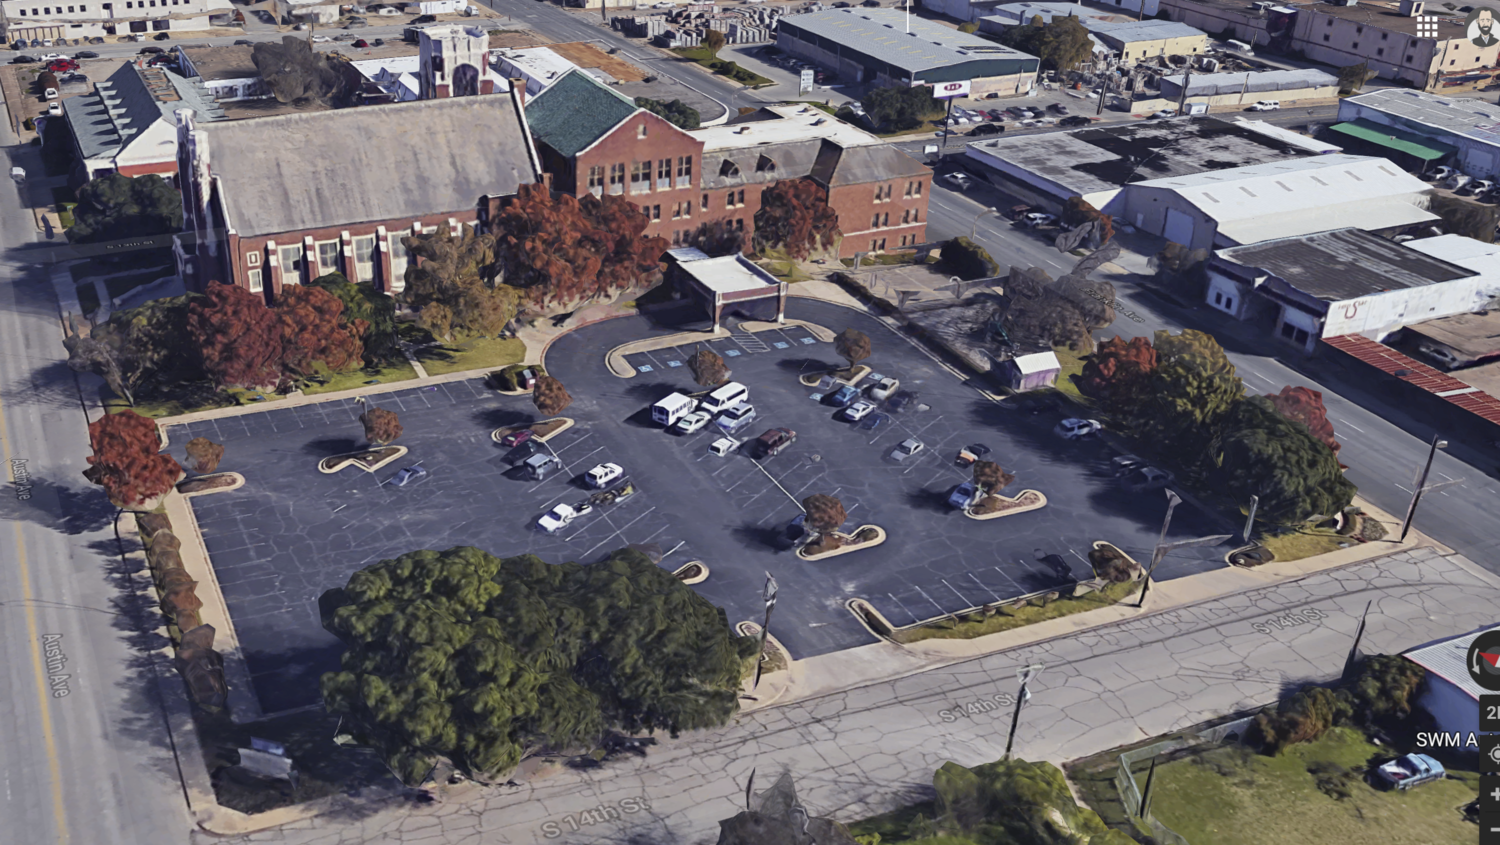
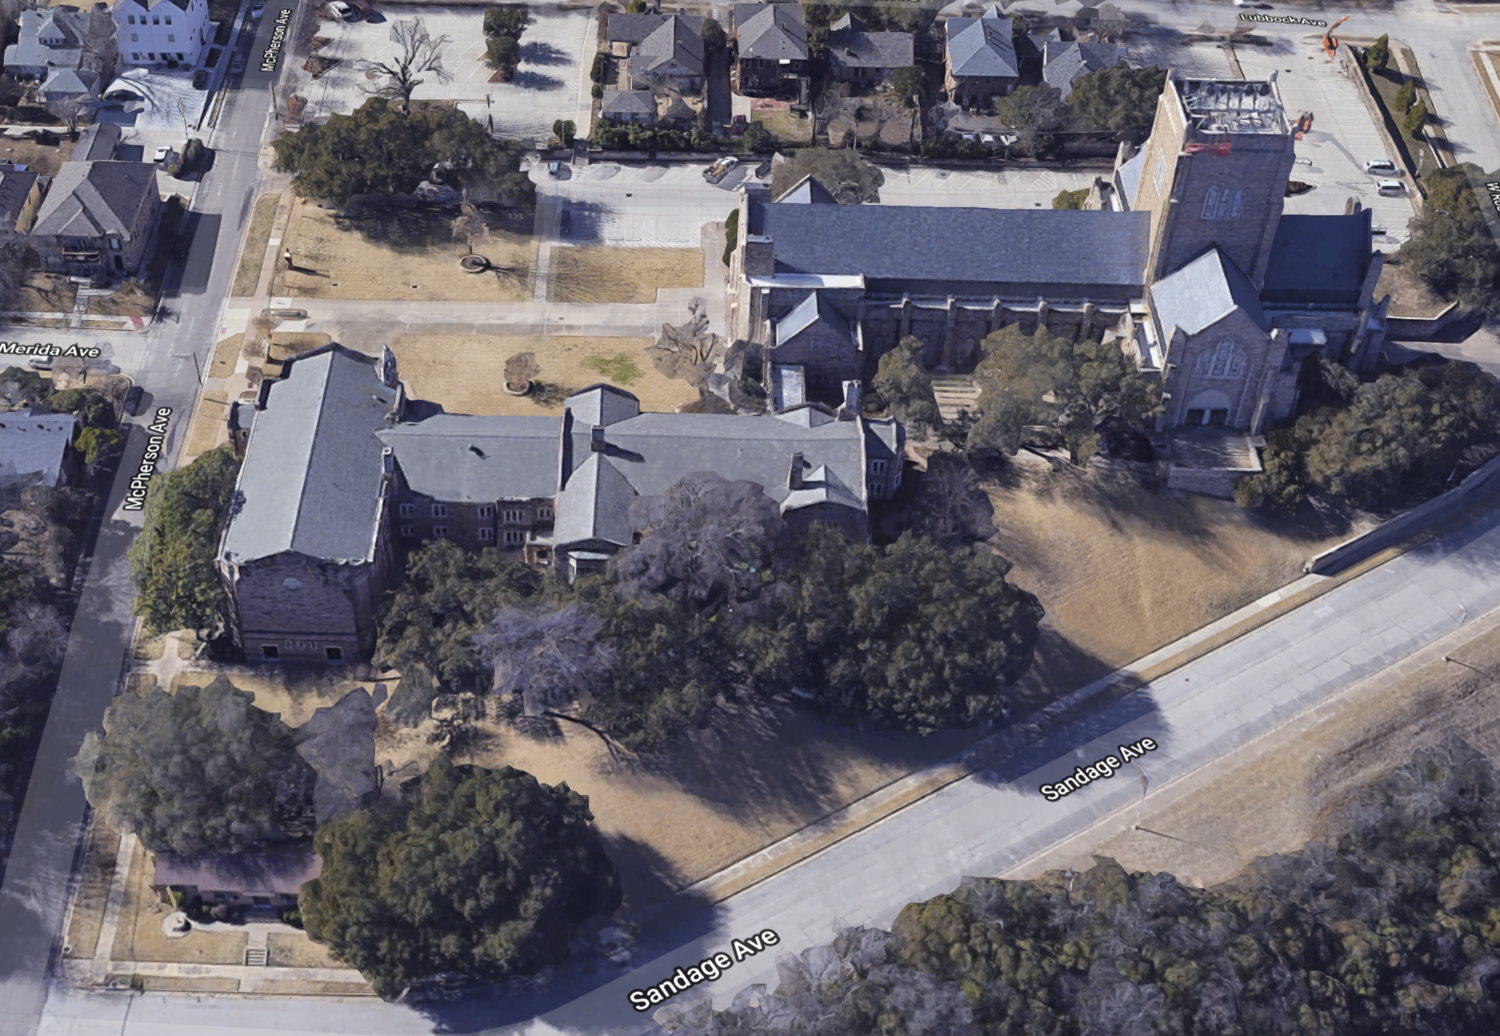
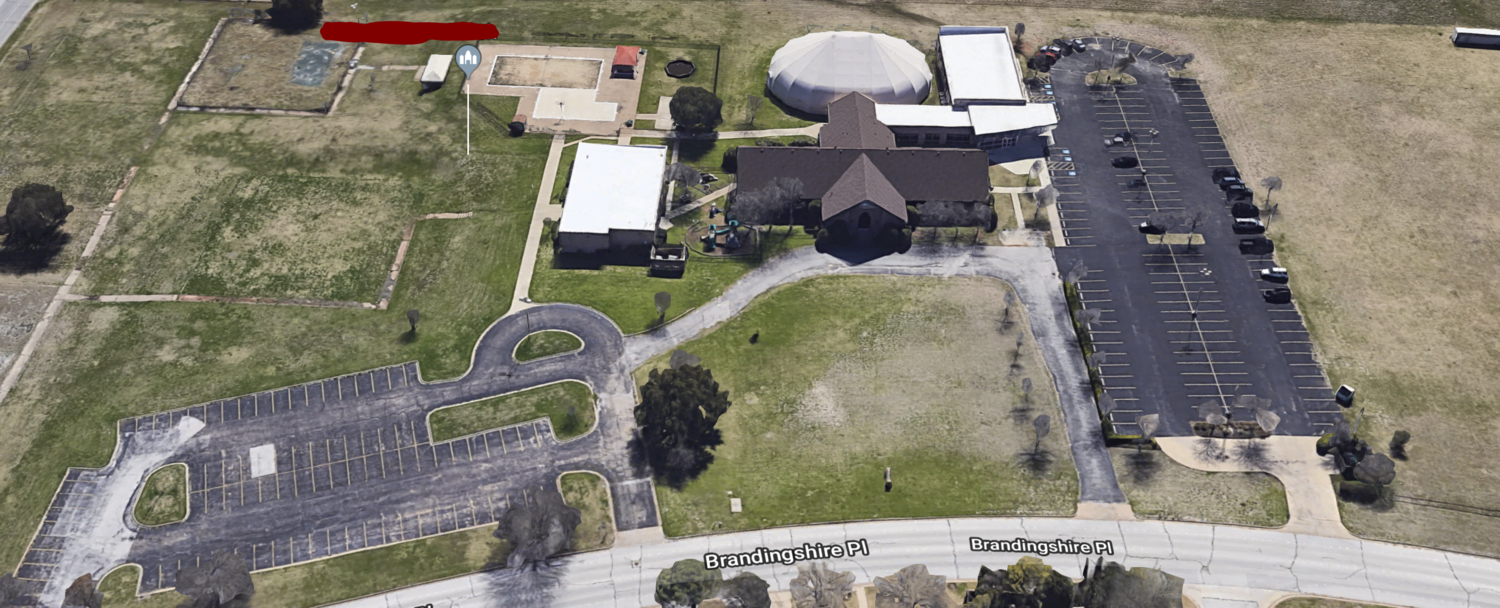
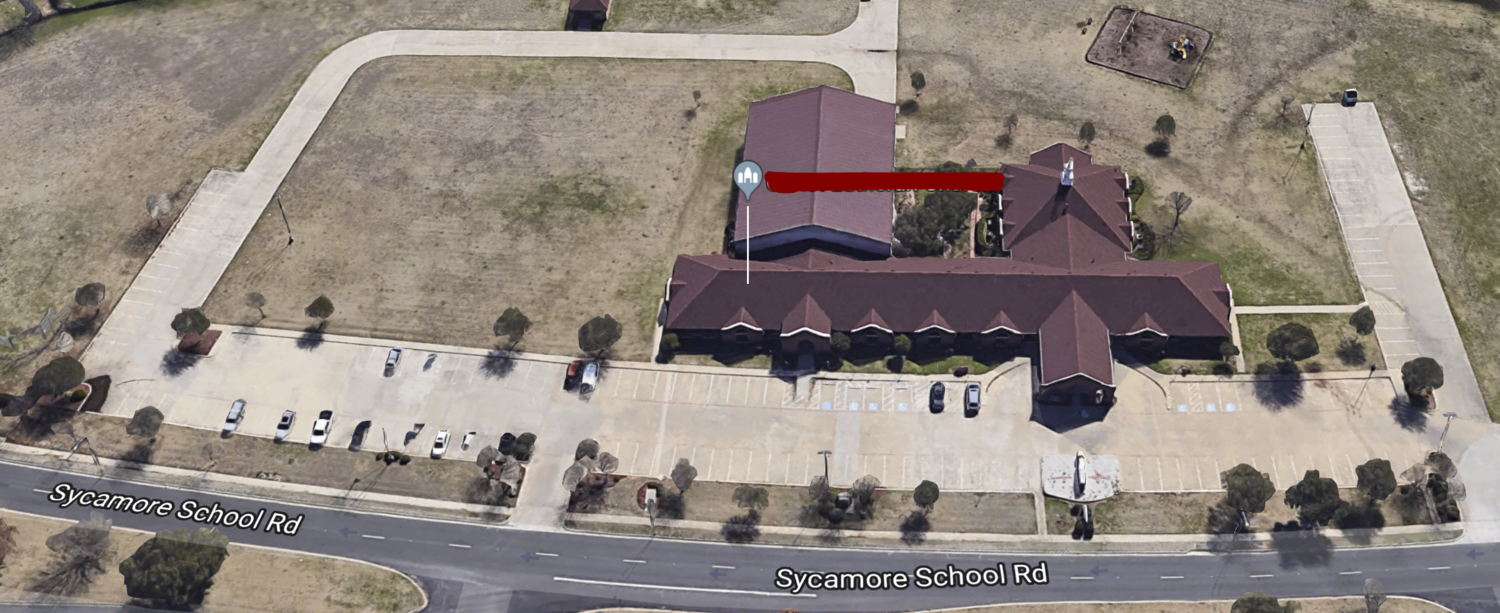
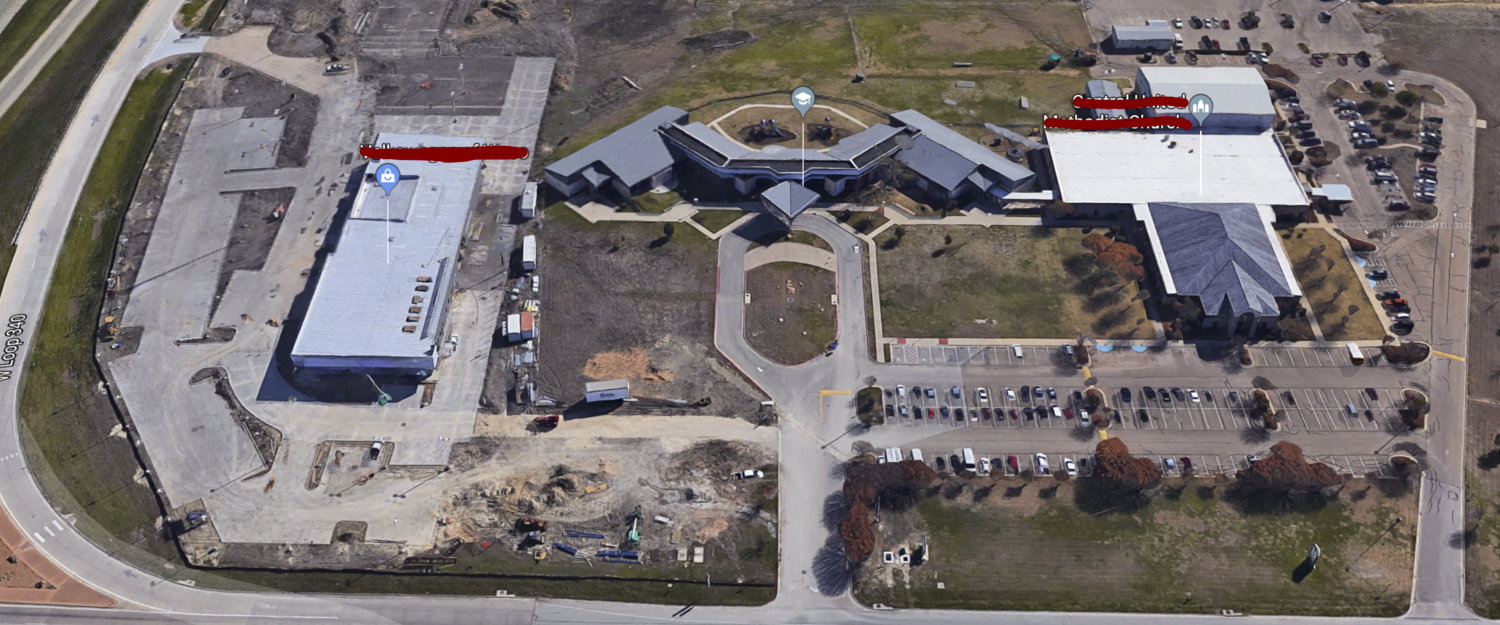
These places of worship follow all the same patterns as the school comparison; older multi-story construction with a smaller cost footprint in the first group and newer single-story construction with a larger cost footprint in the second.
We haven’t even looked at city halls, police stations, fire stations, and libraries. How about the resulting footprint difference with the recent shift away from public pools to public golf courses? That last one should make us cringe for multiple reasons. If we want our land use regulations to support fiscal sustainability rather than hinder it, then we should take a closer look at how we allow tax-exempt entities to build their structures and campuses.
(Cover photo via Wikimedia Commons)


Conventional thought would tell us that the new commercial developments in a city should be the most productive compared to the older buildings downtown, but that’s not necessarily the case.