The Subtle Relationship Between Traffic Deaths and Congestion
Steffen Berr serves as a Director of the nonprofit Build the Lanes, which aims to educate the public about the nature of transportation systems. He currently resides in the Netherlands. This article first appeared on LinkedIn, and it is republished here with permission. You can connect with Build the Lanes on YouTube and Facebook.
The more the world changes, the more some things stay the same. Sixty-five years ago, the United States Congress passed the Federal Aid Highway Act, authorizing the construction of 41,000 miles of interstate highways. But billions of dollars in infrastructure investment and decades later, government officials and engineers continue to struggle against the traffic death and congestion epidemic. Calling this a problem would be an understatement. Research by the analytics firm INRIX pegs the annual cost of traffic congestion at a whooping 88 billion dollars. That is nearly the equivalent of losing the entire economy of Puerto Rico every single year. But, despite billions of dollars in upgrades and numerous commitments to a vision zero policy, traffic deaths and congestion remain stubbornly high. The problem does not stem from a lack of trying, but rather, a failure to recognize the problem for what it is. Unravelling the traffic death and congestion puzzle will require taking a closer look at the nature of both and understanding the subtle relationship that ties the two together.
Traffic Deaths per 100,000 Population vs. Average Hours Lost in Congestion. Image courtesy of the author.
Immediate Takeaways
The positive relationship between traffic deaths and average hours lost in congestion is immediately apparent. The r value, the measurement used for correlation, is approximately 0.48, implying a moderately strong relationship. The r squared value is 0.23, meaning that 23% of the variation of average hours lost in congestion can be explained by the model. That might not sound like much, but when one realizes there are dozens of unique factors influencing traffic, it becomes very significant.
With this relationship established, it is less surprising to observe that the cities with the least amount of traffic deaths, Oslo and Helsinki, also have the least congestion, whereas Philadelphia and Los Angeles suffer from the highest of both.
While this pattern might surprise some readers, it isn’t groundbreaking news for policymakers. Observing deaths rise alongside congestion has persuaded many traffic engineers, city leaders, and parts of the public to try to keep average speeds high via road expansions. Yet as the saying goes, “there are lies, damn lies, and statistics” and as we will soon see, the correct interpretation of the data is just as important as the raw data itself.
Those Who Don’t Learn from History are Doomed to Repeat It
A famous example was the study conducted by the Center of Naval Analyses that analyzed damage done to returning B52 bombers after missions in World War 2. It was quickly followed by recommendations to reinforce the most likely areas to be heavily damaged.
However, a famous Hungarian statistician disagreed and pointed out that the study did not analyze shot down planes. Meaning the study found the parts of the plane most likely to take damage without catastrophic failure and the less damaged parts of the returning planes should boast the most reinforcement.
Thus, the same data can prompt different conclusions based on the interpretation. It is vital to take a closer look beyond what may seem obvious and explain the mechanism producing such results to avoid key errors. If the knee jerk approach of cutting congestion to boost safety is scrutinized, the cracks start to appear.
Wider Roads Have More Conflict Points
To work, road expansions would have to improve safety via widening. However, the opposite is true. This is because of what transportation engineers call “conflict points.”
Consider a two-lane road as a simple example:
Conflict Points on a Two Lane Road. Image courtesy of the author.
There is a total of six conflict points:
Being hit from behind for both vehicles
Hitting someone else from behind for both vehicles
Colliding during a left turn into a driveway for both vehicles
But what happens if the same road is expanded to four lanes?
Conflict Points on a Two Lane Road. Image courtesy of the author.
The number of conflict points has jumped to fourteen and would continue to rise as more travel lanes are added.
The same pattern exists at intersections. A regular four-way intersection with one entrance and departing lane in each direction has thirty-two conflict points as shown below.
In these diagrams, conflict points are calculated by plotting overlapping possible paths of travel at the intersection. As the number of lanes entering and exiting increases, so does the total number of conflict points.
Why do conflict points matter? Because research suggests that conflict points can be a useful surrogate for predicting accidents. It does not seem that cutting congestion via expansion is possible, if the expansion itself makes roads fundamentally more dangerous. This also does not even take into account evidence which shows that drivers behave more recklessly on wider roads and are a greater risk to pedestrians and cyclists.
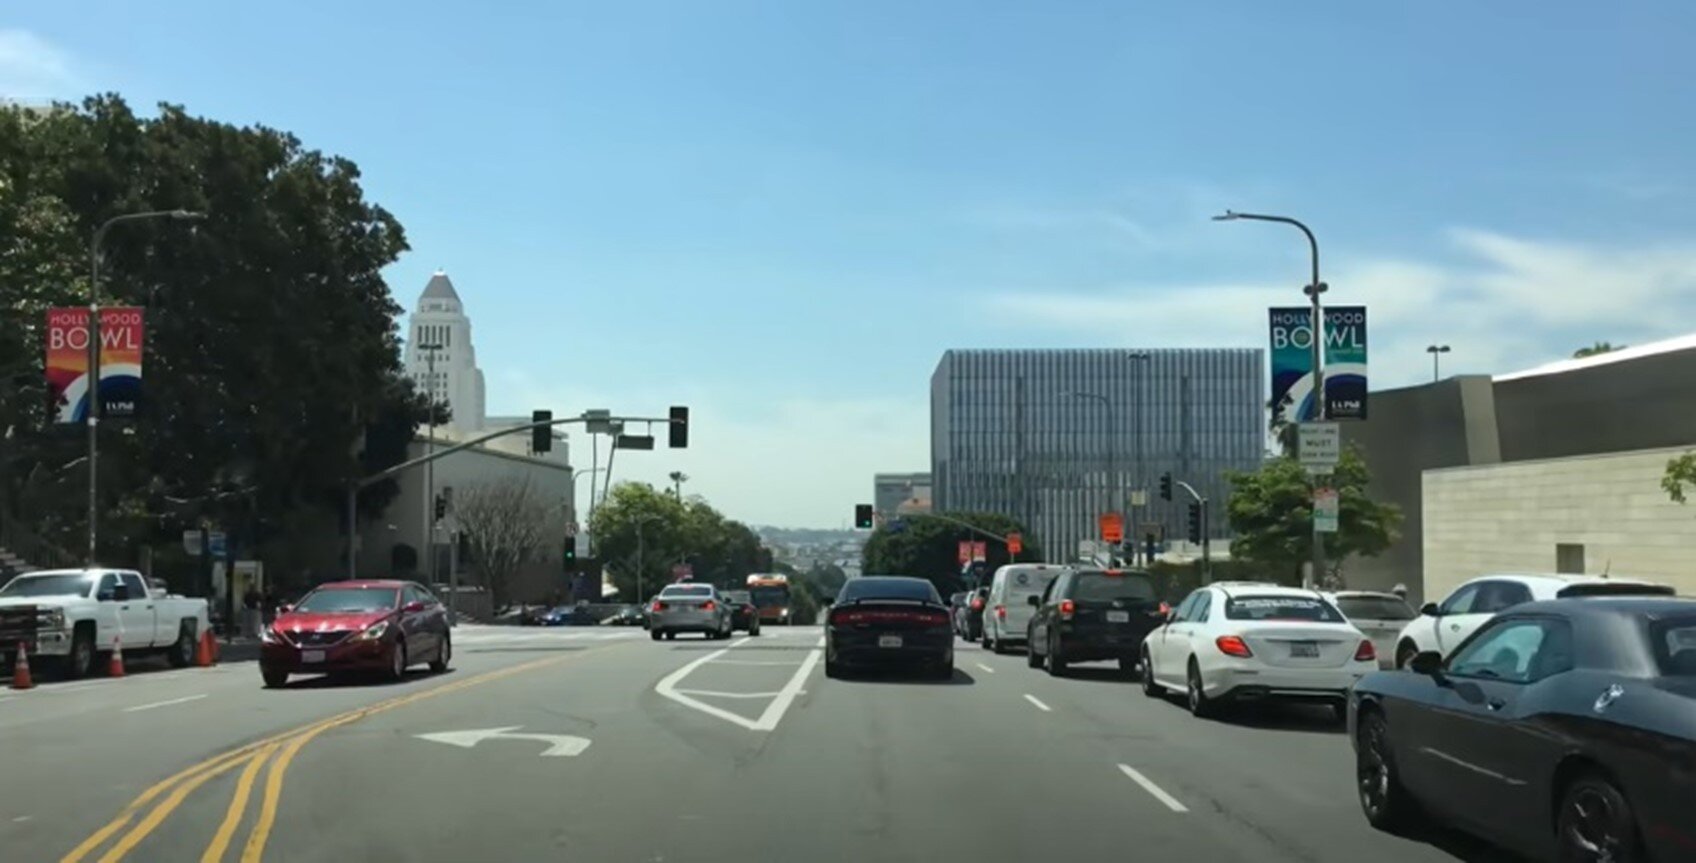
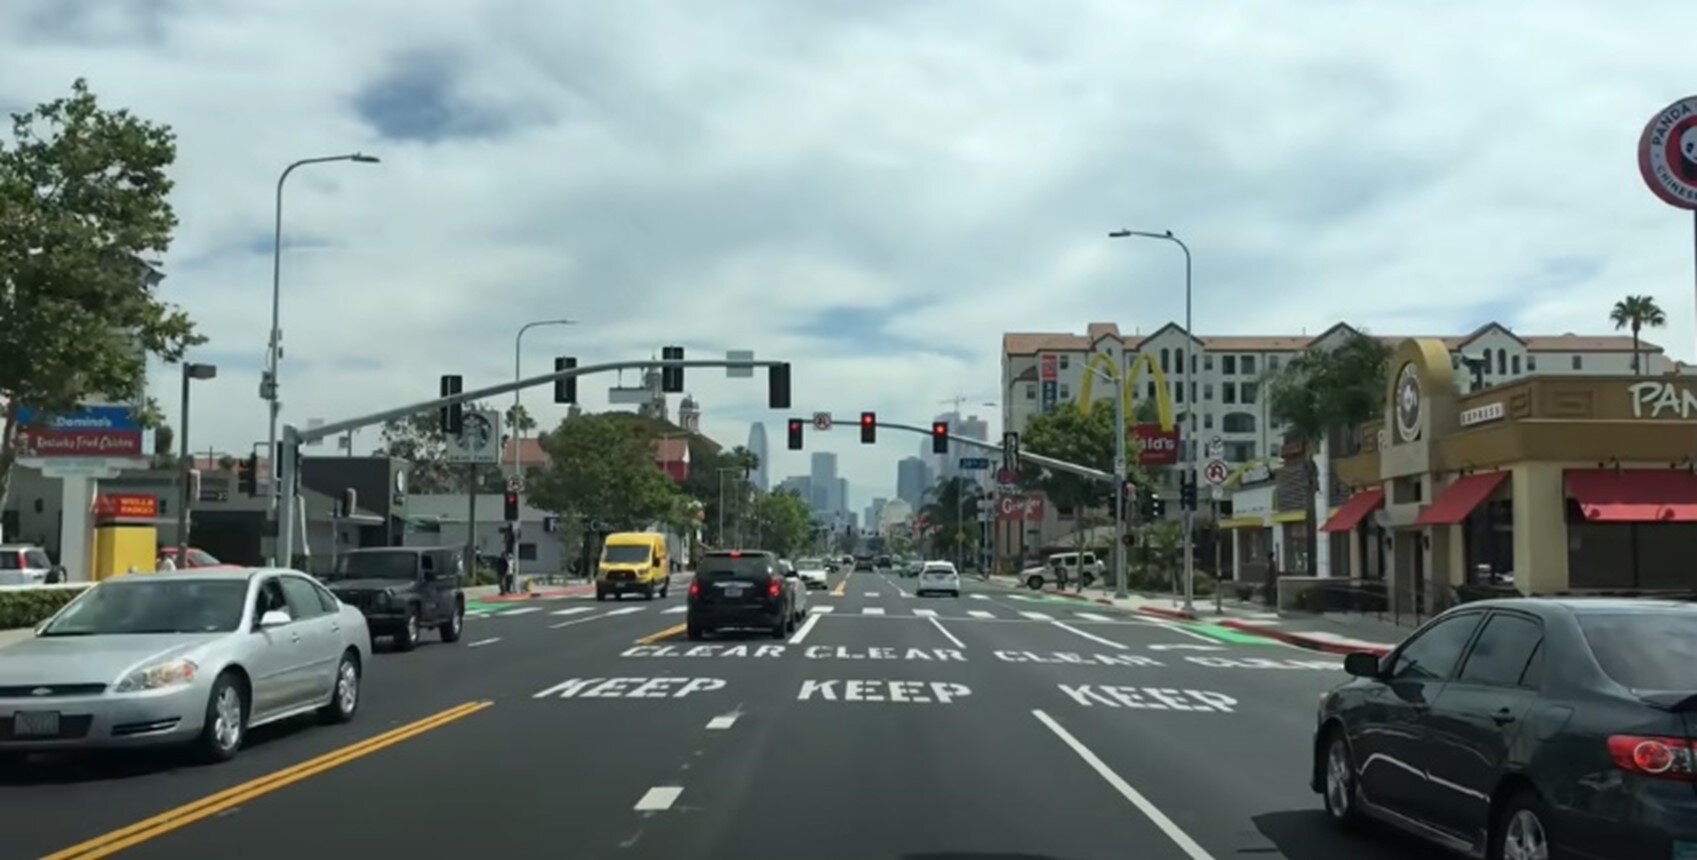
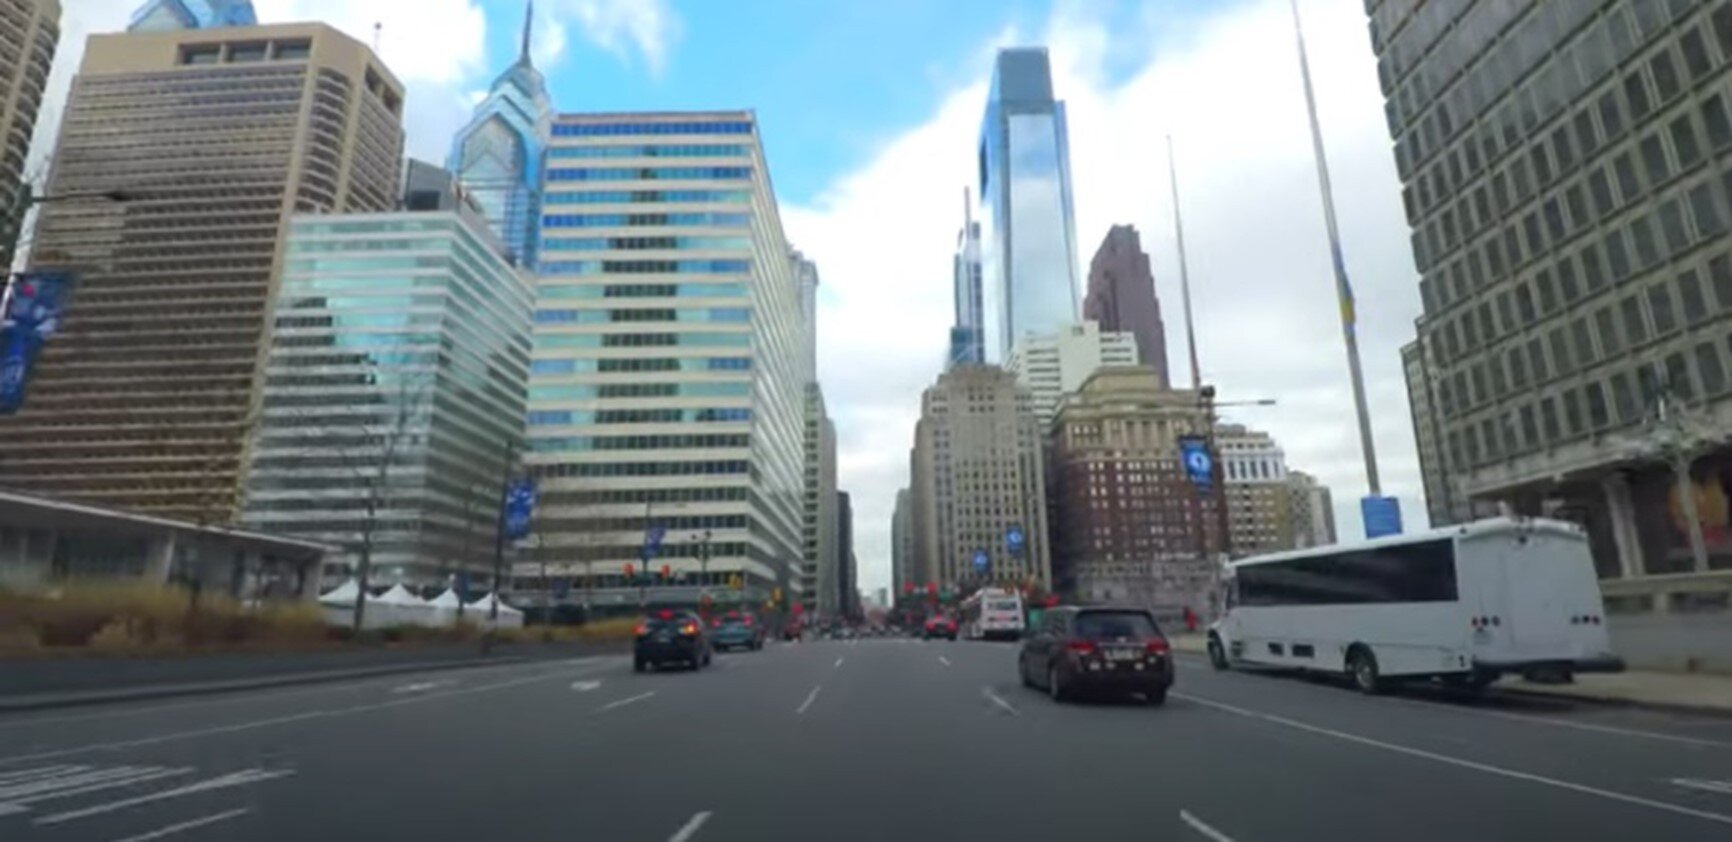
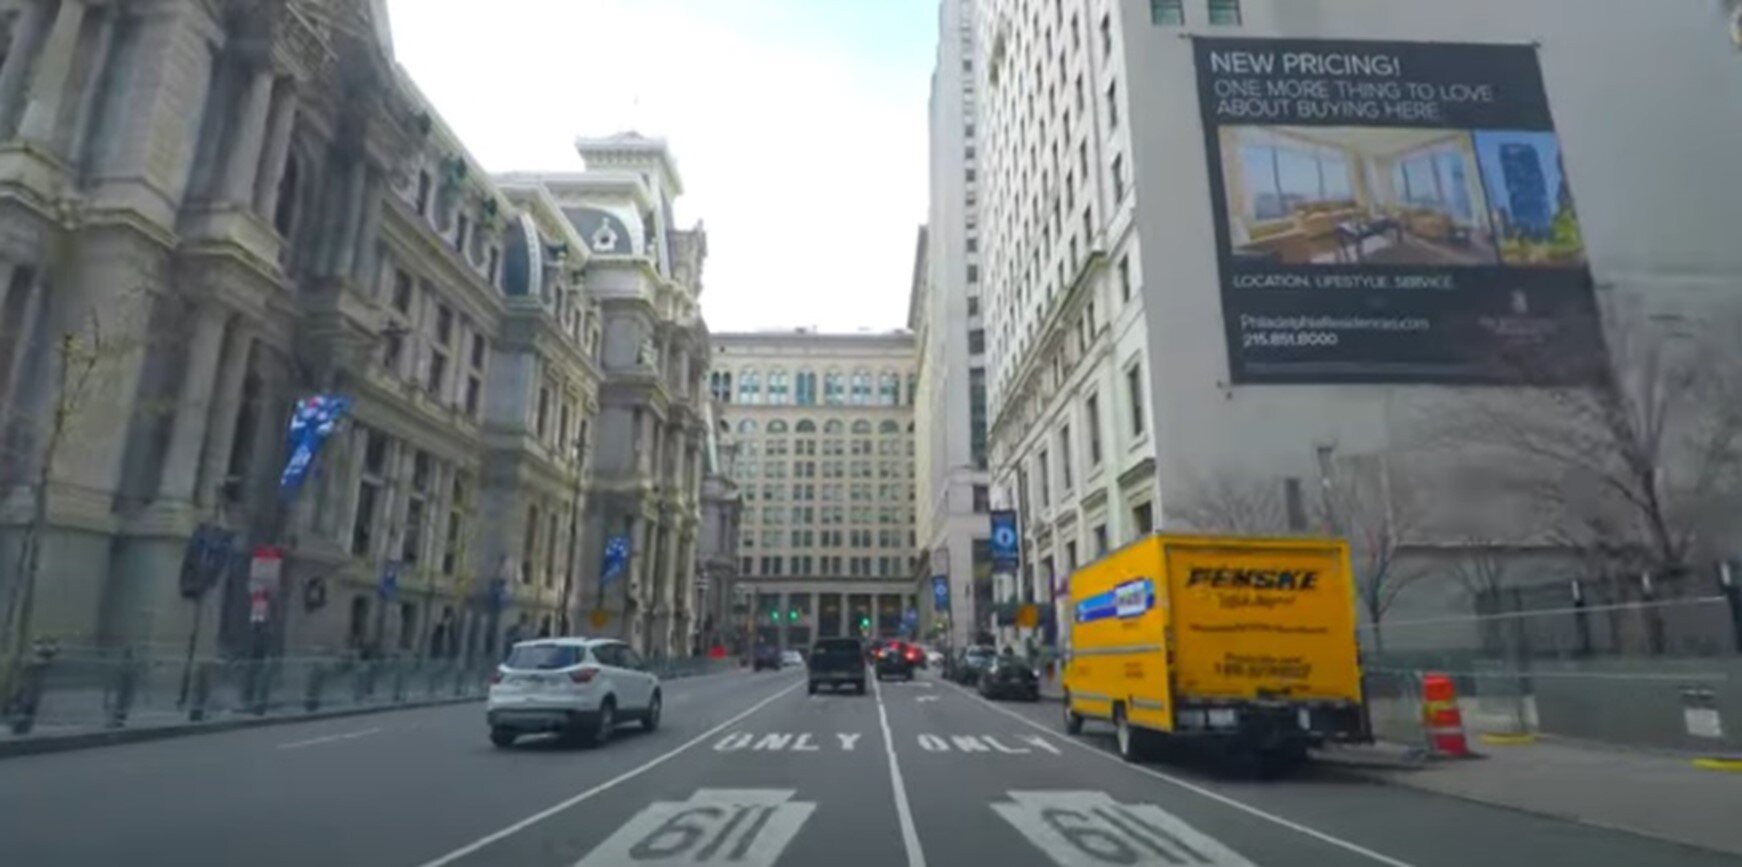
The final nail in the coffin comes from examining the worst performers of the eighteen cities in the model: Philadelphia and Los Angeles. What is a common theme in these cities? Very large highways, roads, and intersections that are left behind from a legacy of trying to improve safety by cutting congestion.
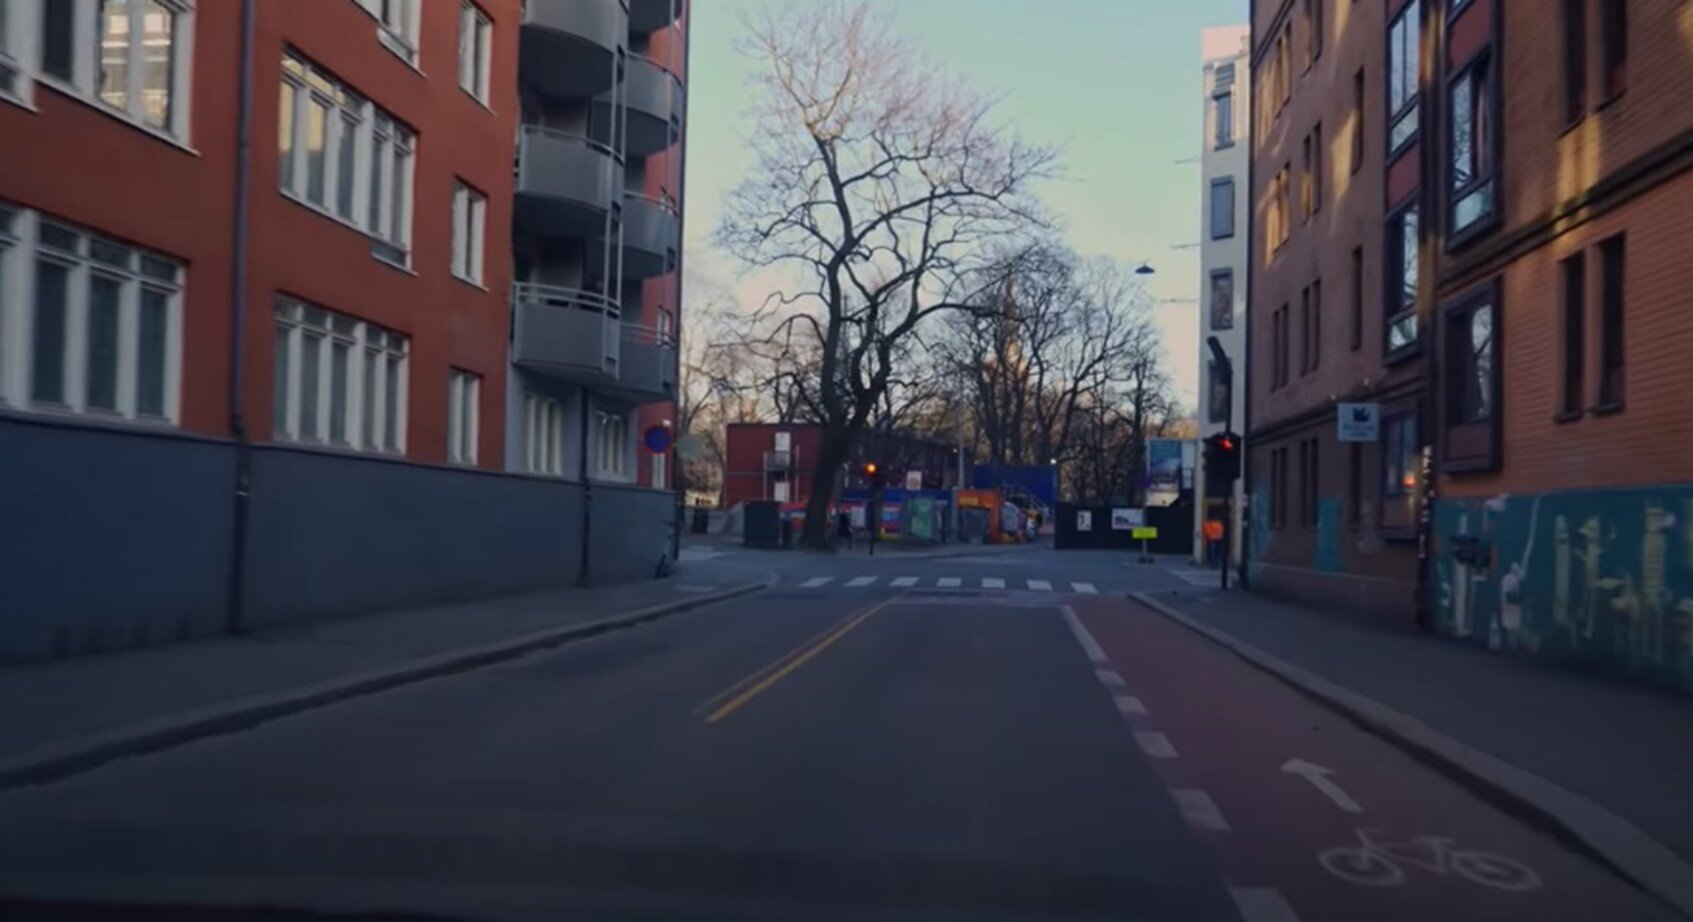
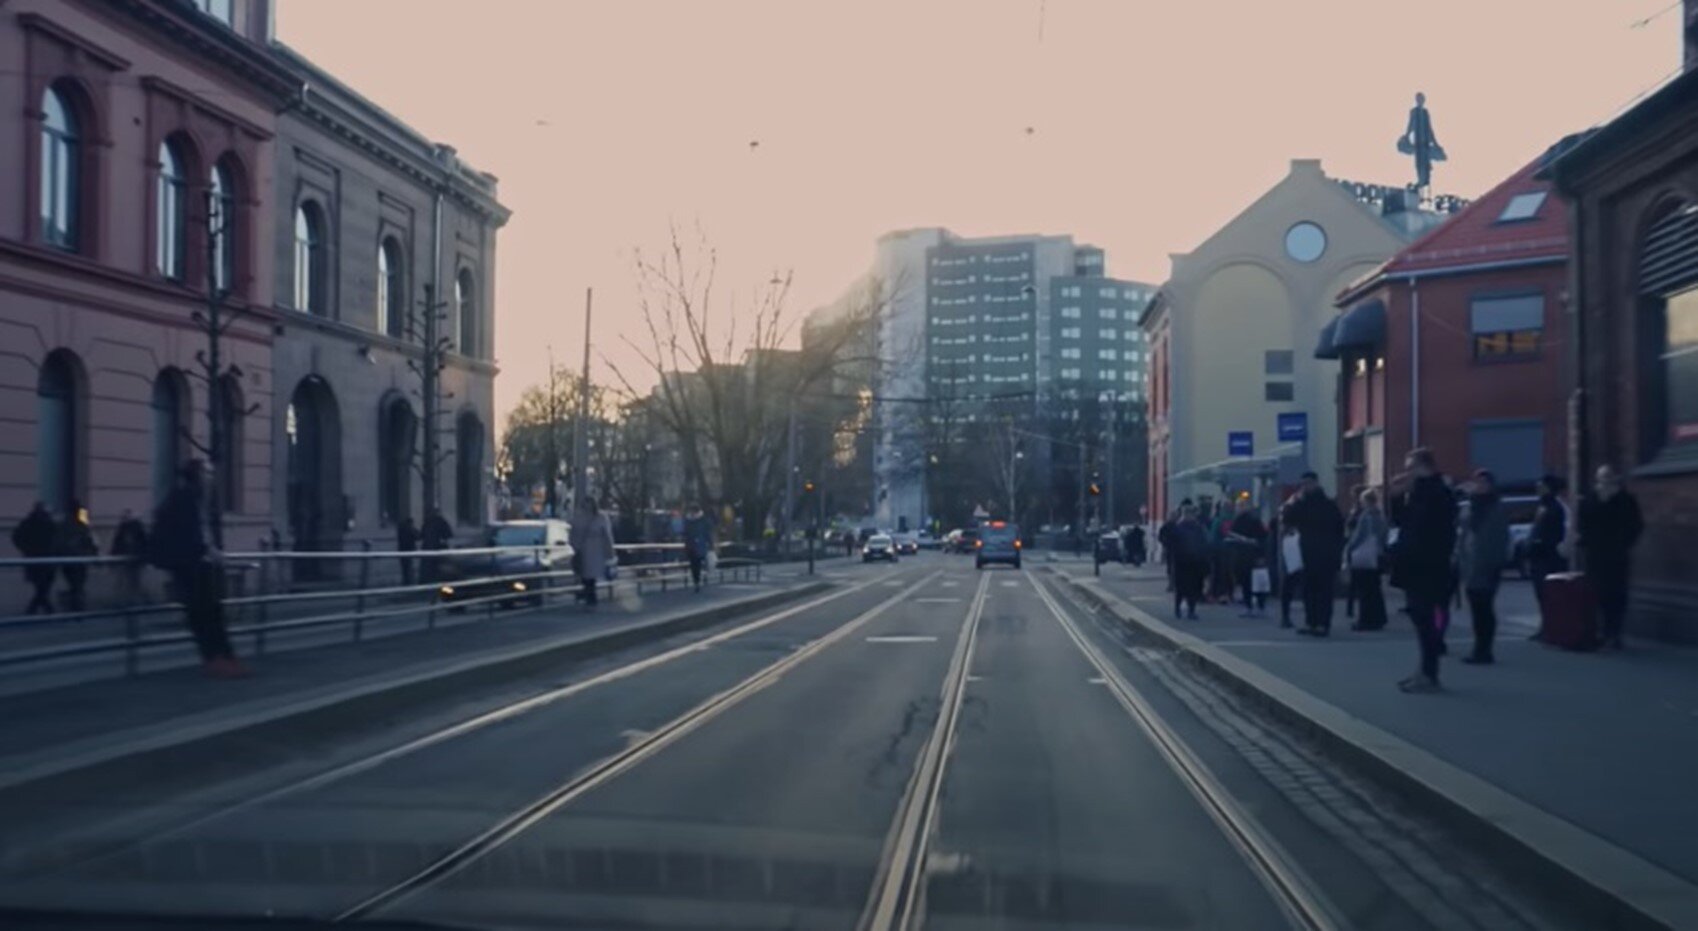
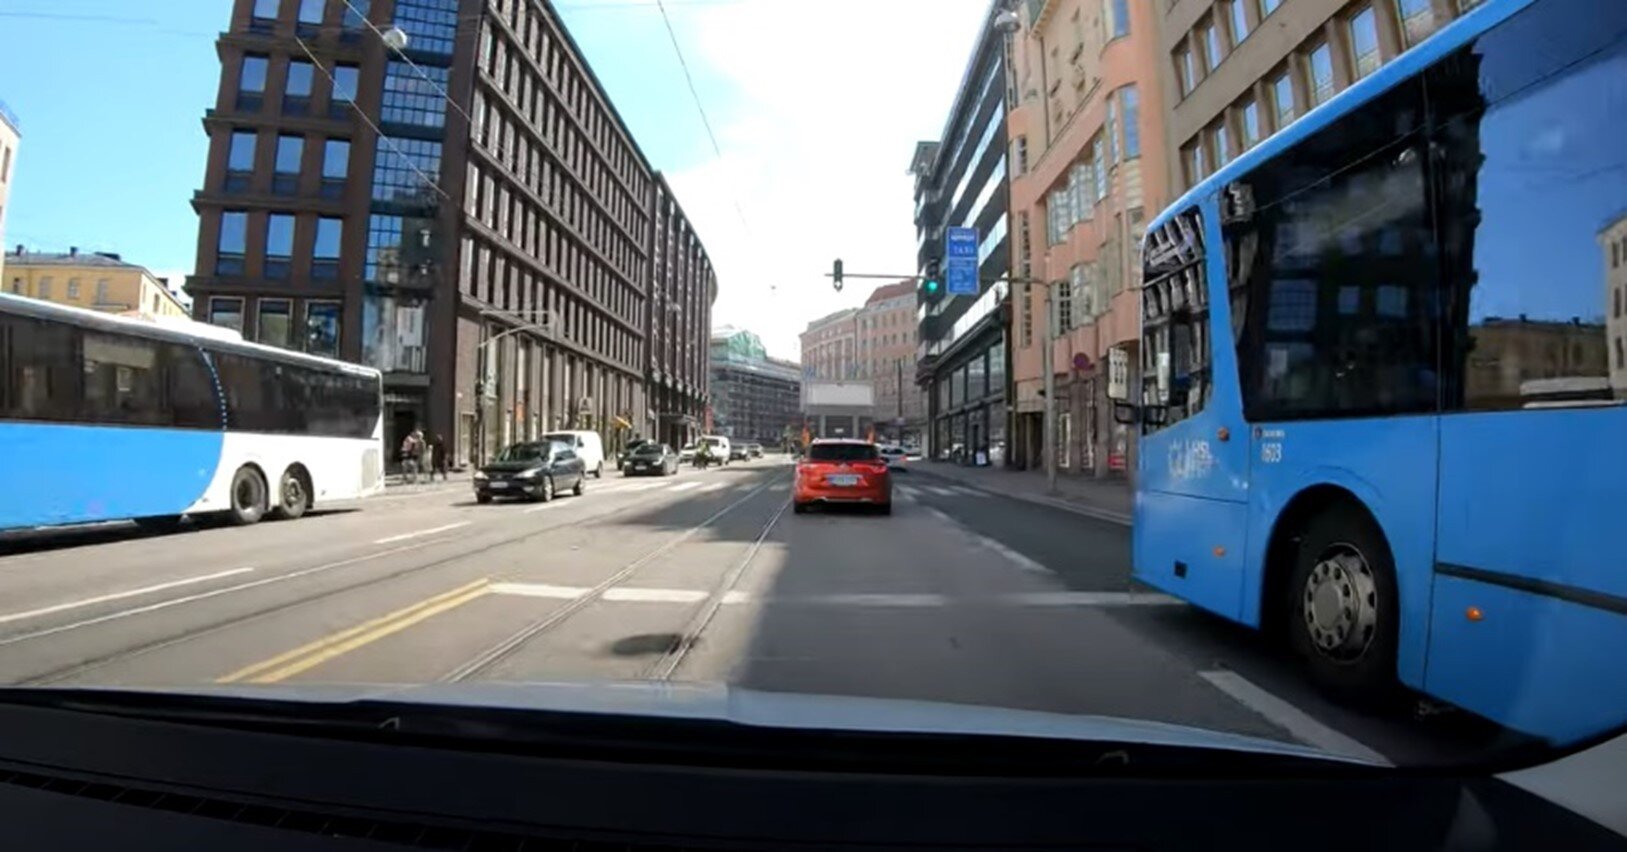
A snapshot of roads in Los Angeles and Philadelphia:
Beating Congestion by Boosting Safety?
Because improving safety by reducing congestion fails to work, we must consider an overlooked explanation that serves as a mechanism for correlation between traffic deaths and congestion. Perhaps making roads safer is what cuts congestion. This might sound strange at first. How is that even possible? Consider a typical road diet project below as a simple example.
A Typical Road Diet Project. Image courtesy of the author.
As we established in figures 3 and 4, narrower road sections have fewer conflict points and tend to be much safer. But how does this mean less congestion?
In figure 14, assume that the original road width was forty-eight feet wide, with four travel lanes at twelve feet each. The new road section has three lanes at ten feet wide for each. That leaves a space surplus of eighteen feet. This could be used in a variety of ways, such as:
Putting in a 12’ wide two-way cycle path with a green barrier
Putting in a new tram line
Creating a bus-only lane
Expanded sidewalks
Or a combination of these
This is crucial in getting road users to switch to other transportation modes. More space and protection provide a significant boost for active transportation, and dedicated space for transit makes it competitive with driving for commuters.
The Mechanism
Less road trips by cars go a long way in reducing congestion levels in cities. Time lost from congestion increases exponentially as more cars are added to a road system. However, it is also known that there are exponential time savings as cars are removed from the system.
Based on the snapshots, it would indeed seem that the road facilities in Oslo and Helsinki are considerably smaller than their counterparts in Philadelphia and Los Angeles. It is also common to see that space has been allocated to promote the safe and efficient use of alternatives, whether that is walking, cycling, or taking the bus or tram.
Closing Thoughts
These real-world examples verify the subtle relationship between road safety and congestion. The safest roads lose the least time from congestion and the most dangerous lose the most. Although it might seem tempting to improve the situation by cutting down on congestion, the fundamentals of road geometry and real-world examples reveal that it is a flawed strategy and ultimately fails. Instead, we must embrace what seems counterintuitive. Only by improving the safety of the road system by downsizing facilities can other modes be made comfortable and efficient enough, which can in turn squash congestion levels.
Ultimately, solutions are only as good as the understanding of the original problem. The congestion and traffic death epidemic has persevered for more than a century largely due to a lack of understanding among policy makers of the subtle relationship between traffic deaths and congestion. With a better understanding of the problem and the necessary political will, the days of being stuck in traffic and listening to the report on the latest road fatalities may be numbered at last.


