Forget Growth for Growth’s Sake—Langley Residents Want to Know What Pays
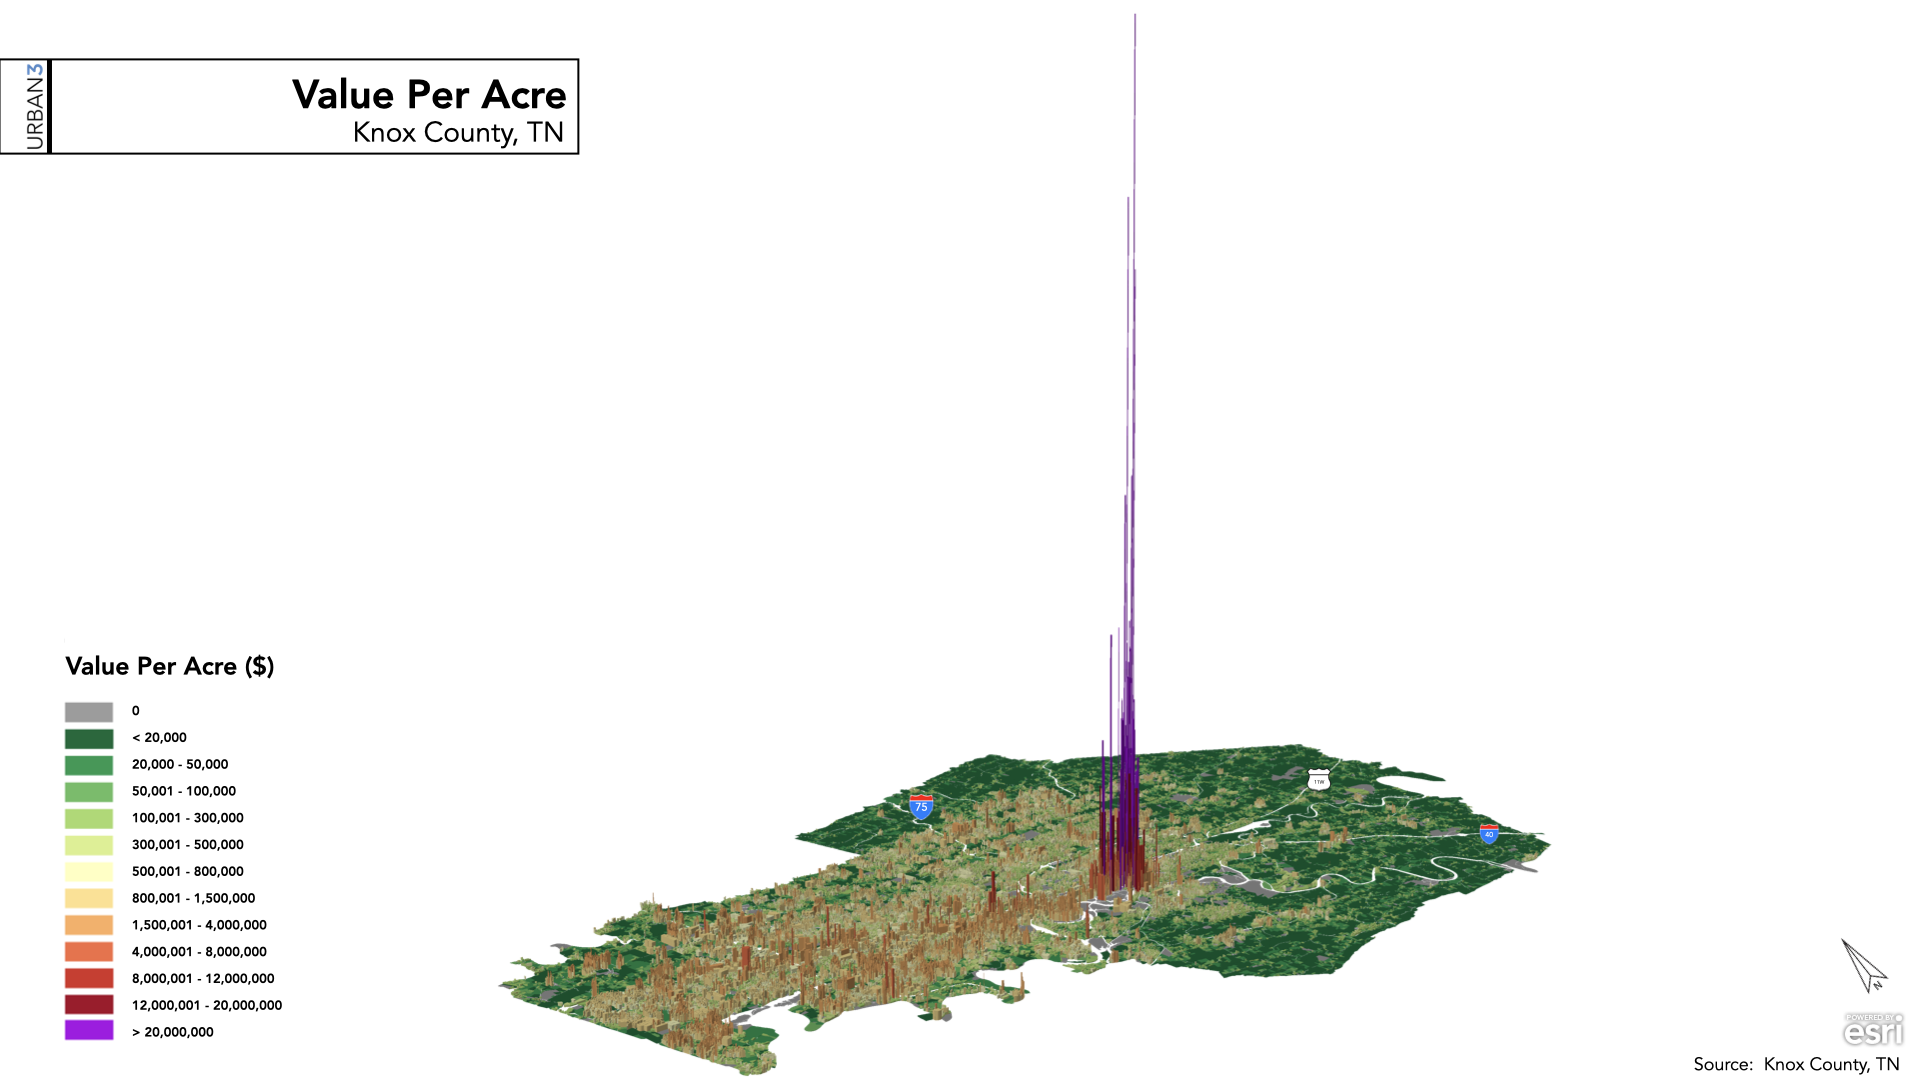
An example of a value-per-acre map produced by Urban3.
What if you could see where your city makes money—and where it quietly loses it?
That’s exactly what a group of residents in Langley, British Columbia, set out to do. As part of Strong Towns Langley, they created their own value-per-acre map. The tool is inspired by the data visualizations developed by Urban3, a planning firm known for translating complex municipal finance data into clear, compelling maps that show which properties generate the most value for their communities.
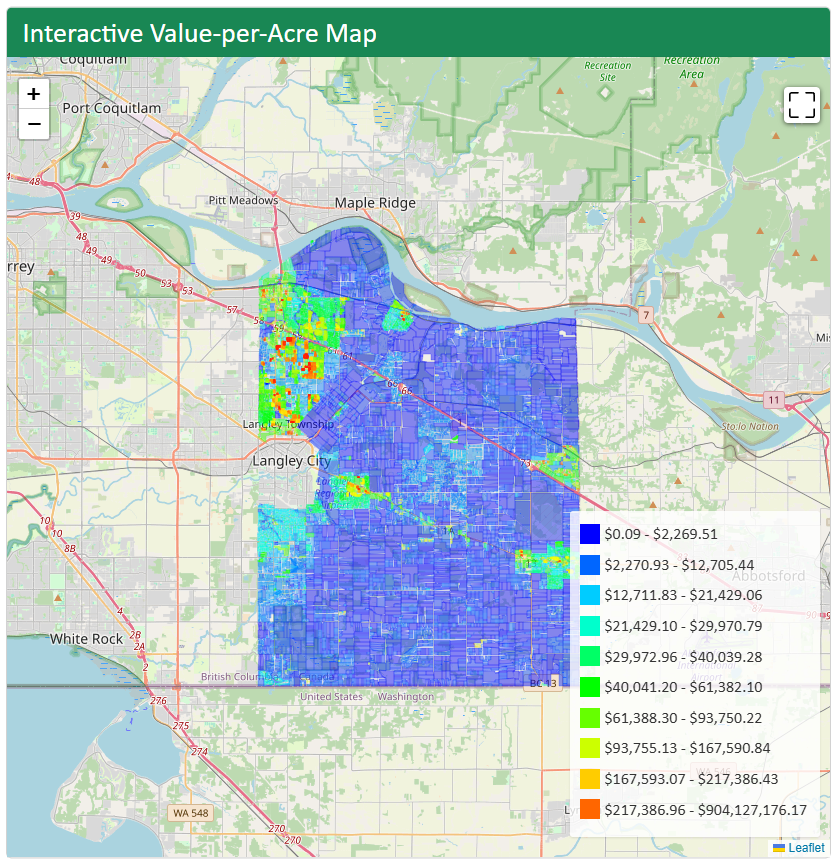
This map shows the taxable value per acre for properties in the Township of Langley. Higher values (red) indicate areas that generate more tax revenue per acre, while lower values (blue) generate less.
Langley’s version is no exception: it’s a powerful, easy-to-use resource that helps residents, planners, and decision-makers see which parts of the city produce the most tax revenue relative to their size—and which ones cost more to serve than they generate.
Seeing the Invisible
The value-per-acre map uses publicly available assessment and tax data to show, parcel by parcel, how much revenue each property brings in. The results echo a pattern seen in many communities: modest, mixed-use buildings and walkable town centers often generate more revenue per acre than large commercial sites. Big-box stores with expansive parking lots may look productive, but they tend to occupy far more land and often require more infrastructure investment to support.
It’s the kind of analysis that challenges conventional wisdom. And thanks to Strong Towns Langley, anyone can dig into the data themselves: the interactive map is freely available on their website, complete with notes and how-to guides.
Langley’s work pairs seamlessly with the new Strong Towns Finance Decoder, a tool designed to help local governments evaluate the long-term financial health of their communities. While the Value-per-Acre map zooms in on block-by-block productivity, the Finance Decoder zooms out—walking users through big-picture metrics like net financial position, debt servicing costs, and infrastructure obligations.
Together, these tools provide a powerful framework for asking better questions. They help shift the conversation from “How do we grow?” to “Can we afford to maintain what we’ve already built?” From “How do we attract development?” to “Is this building lasting value—or adding long-term liabilities?”


